CHAPTER TWO
Salt Marsh Succession: Geomorphological
Controls
on
Pattern and Process
2.1 INTRODUCTION
In the most traditional sense, the term "succession"
refers to the unidirectional change in the composition of an ecosystem
where one group of organisms replaces another until a climax community
is attained. Since the first ideas of Cowles were published in 1901, nearly
a century ago, alternative definitions of succession have been discussed
in the ecological literature. In 1969, Odum presented a definition of succession
that seems to be generally accepted today. He stated that:
(i) It is an orderly process of community development
that is reasonably directional and, therefore, predictable. (ii) It results
from modification of the physical environment by the community; that is,
succession is community-controlled even though the physical environment
determines the pattern, the rate of change, and often sets limits as to
how far development can go.
(iii) It culminates in a stabilized ecosystem in
which maximum biomass and symbiotic function between organisms are maintained
per unit of available energy flow.
The purpose of this paper is to examine parts (i)
and (ii) of Odum's definition in relation to succession in a salt marsh.
First, the aim is to characterize salt marsh succession, especially as
it relates to the creekbank region of the marsh. Second, the aim is to
identify and discuss the modification of the environment by the vegetation
during succession. Third, the aim is to characterize what aspects of the
physical environment determine the patterns and the rate of change within
the system.
2.1.1 Salt marsh succession
The first question to be addressed is: does succession
occur in a salt marsh? There is no succession in the classic sense of the
replacement of one community by another. There is only a single macrophyte,
the salt marsh cord grass, Spartina alterniflora, which grows
predominantly in monospecific stands. The lack of a progression in plant
species over time was recognized by Johnson and Raup in 1947. In an examination
of Massachusetts salt marsh peat, they found that there was only detritus
from cord grass. The development of the marsh ecosystem cannot be characterized
by the change in species composition, as is possible in many terrestrial
systems; thus, marsh succession must be defined by changes of a different
nature. Cowles (1901) noted that the character of the soil on a sand dune
changes along with the species composition; and Olson, in an examination
of these same soils 50 years later discussed the change in the sorptive
capacity of the soils (1958). Thus, succession in a salt marsh can potentially
be described by changes in the physico-chemical properties of the substrate.
Indeed, as a marsh ages: (1) the organic content of the sediment increases
(Craft et al 1988a, Osgood & Zieman 1993b), (2) the nutrient reservoirs
increase (Osgood & Zieman 1993b, Craft et al. 1988a), and (3) the redox
potential (Eh) decreases (Osgood & Zieman 1993b).
Further, in their 1973 review of successional work
to date, Drury and Nisbet concluded that traditional theories of succession
did not adequately describe the existing field data, and that the changes
observed in the patterns and processes are not necessarily associated with
a change in the species composition. They suggested that a "comprehensive
theory of succession should be sought at the organismic or cellular level,
and not in emergent properties of communities." This idea was also offered
earlier by Shelford (1911) where he discussed that ecological succession
is based upon "physiology, habits, behavior, mode of life
" of the species,
and not necessarily on the change in species present. In a salt marsh,
the primary production increases and stabilizes over time (Broome et al.
1986). The quantity of S. alterniflora biomass may be a useful
proxy in characterizing succession in a salt marsh. In addition, with the
changes in the physico-chemical nature of the substrate, the physiology
of the plants may change as well. This study examines some of the physiological
changes that take place within the organism during the successional process.
2.1.2 "Reaction" during salt marsh succession
In 1916 Clements presented the idea of 'reaction',
which is "the effect which a plant or a community exerts upon its habitat".
Reaction is explained in the second part of Odum's definition as: "the
modification of the physical environment by the community" (1969). Reaction
theory was generated in order to explain the progression from one sere
to the next, with the idea that one sub-climax sere alters the environment
such that it is prepared for the species of the next sere. Figure
2.1 is a schematic diagram illustrating some of the potential pathways
whereby the vegetation, S. alterniflora, interacts with the
environment in a series of biotic-abiotic feedbacks. There are certain
biotic-abiotic interactions which act to change the physico-chemical nature
of the substrate, and which will thereby affect the rate at which the marsh
develops. The role of these feedbacks is examined within the framework
of successional changes within the marsh.
2.1.3 Physical controls on the rate of succession
Salt marshes are physically driven systems. In these
systems, the landscape influences the hydrology, which influences the chemistry,
which controls the productivity. Thus, it follows that the rate of succession
of a salt marsh will be controlled to a great extent by the physical forces
which create the patterns that we see. The landscape of a marsh is often
dissected by meandering tidal creeks. In a mature marsh, the creekbank
is generally associated with tall form S. alterniflora. The relationship
between the tall morph of S. alterniflora and the creekbank has
been attributed to the increased pore water movement in this region (Wiegert
et al. 1983). The increased flushing has, in turn, been linked to increased
sediment aeration (Agosta 1985), increased nutrient supply (Valiela et
al. 1978), decreased salinity (Phleger 1971) and decreased sulfide (King
et al. 1982). Salinity and sulfide have both been shown to inhibit N uptake
by S. alterniflora (Bradley & Morris 1990, Bradley & Morris
1991, Morris & Dacey 1984). Thus, the plants in this region will be
better able to take up nitrogen because the concentrations of salts and
sulfide will be lower. Howes et al. (1994) demonstrated that a significant
amount of inorganic nitrogen and DOC are lost from the creekbank through
seepage at low tide. In a mature marsh, these losses are balanced by the
benefits of increased flushing, such that the S. alterniflora grows
vigorously in these regions. In addition, Osgood et al. (1995) have put
forth the idea that in younger marshes, where the substrate is sandy, the
increased hydraulic gradient imposed by the slope at the creekbank will
cause greater throughflow of nutrients. Even though measured concentrations
are low, the total amount of N available to the plant is high. Thus, the
morphological variation at the creekbank leads to a change in the subsurface
hydrology. This, in turn leads to changes in the porewater chemistry, which
affects the production of the plants. As illustrated in Figure
2.1, when the environment acts to change the production of the plants,
there is a feedback whereby the plants then act to alter the physical environment.
As the final aim of this study, the environmental controls on the marsh
ecosystem will be examined in order to determine the role that they play
in the rate of successional change in the marsh. The creekbank region of
the marsh will be examined because it is an area where there is great spatial
variability in the landscape, and thereby in the hydrological and chemical
environment.
2.1.4 Introduction to the current study
Past studies of marsh succession have been primarily
associated with restored and created marshes (e.g. Broome et al. 1986,
Sinicrope et al. 1990, Craft et al. 1988a, Craft et al. 1988b). These studies
have examined changes in primary production (Broome et al. 1986) species
composition (Sinicrope et al. 1990), nutrient and organic carbon reservoirs
(Craft et al. 1988a), and the sources of organic matter in these marshes
(Craft et al. 1988b). Few studies have focused on naturally developing
marshes (e.g. Redfield 1965, 1972, Osgood & Zieman 1993a, Osgood &
Zieman 1993b, Osgood et al. 1995). While the geomorphological evolution
of tidal creeks and tidal creek networks has been extensively studied (e.g.
Pestrong 1965, Garofalo 1988, French & Stoddart 1992, Knighton et al.
1992, Shi et al. 1995), the relationship between the tidal creek and the
development of the vegetated portion of the marsh has not been examined.
This study takes place on a chronosequence of marshes,
where marshes ranging from 1-150+ years exist side by side (J. Walsh, pers.
comm.). The Hog Island marsh chronosequence site provides a natural experiment
where instantaneous observations of the changes that take place as a marsh
matures can be made through a space for time substitution. In addition,
the geomorphological variability present at the site allows for comparison
studies to be made with out a great deal of damaging experimental manipulation.
In instituting this space for time substitution, we are making the assumption
that the 'snap-shots' of ecosystem pattern and process at difference ages
represent real trends, and that all of the marshes in this chronosequence
are following the same developmental trajectory. This provides a test of
the idea that succession is a unidirectional process, and this will be
discussed in light of the results.
2.2 METHODS
2.2.1 Site description
This study takes place on Hog Island (Figure
2.2), a barrier island off of the coast of the Delmarva Peninsula,
Virginia. It is a part of the Virginia Coast Reserve Long Term Ecological
Research project. The island is a highly dynamic environment, which is
subject to frequent disturbances (Hayden et al. 1991). This is exemplified
by the fact that the town of Broadwater, a town with nearly 250 inhabitants
at the turn of the century, is now underwater some distance from the present
shoreline of the island (Badger & Kellam 1989). In March of 1962 a
large and powerful coastal storm caused a washover event which deposited
nearly a meter of sand on the mature marshes on the eastern side of the
southern end of the island (Stewart 1962). Since this overwash event, the
fringing S. alterniflora marshes have gradually regrown on the bay
side of the island.
Five sites were selected for this study. There are
four creeks, and one site at the edge of the lagoon. The approximate ages
of the creek sites are 5, 6, 15, and 150+ years as of 1996. The fifth site
is approximately 3-4 years old, and is included to be able to compare a
site that has developed at the edge of lagoon with sites that developed
at the edge of a creek. 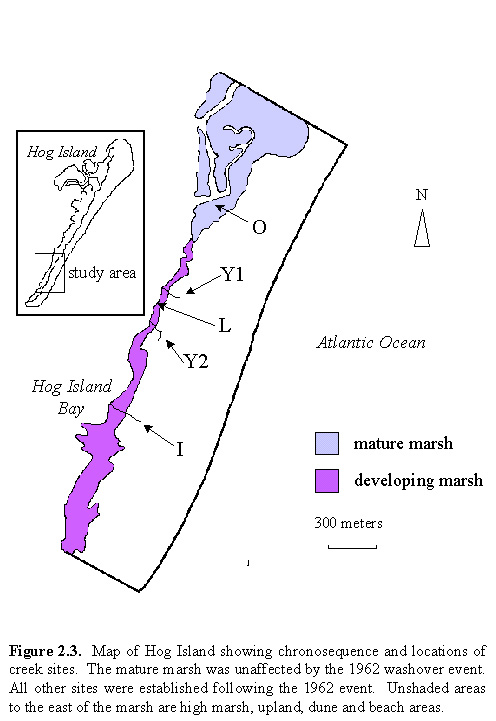 The
ages of the sites were determined by inspection of aerial photographs.
I have defined age as the time since S. alterniflora has been visible
on these photographs, and it is thereby the ecological age of the site.
All of the young sites are the result of the 1962 washover event, and therefore
have the same geological age. The 150+yr site was not affected by the 1962
washover. The age of this site is not known precisely, but it was present
as a marsh on maps dating back to the 1840s (J. Walsh, pers. comm.). It
may be older than 150yr, but it is most likely that it has the same sedimentary
origin, in that the marsh platform was probably lain down by an earlier
washover. Figure 2.3 is a map illustrating the positions of each site.
The two young creeks, hereafter referred to as Y1 and Y2, which are 0.5-.75
m across, become discontinuous with the lagoon after the water has fallen
past a certain level. The intermediate aged creek, hereafter referred to
as I, is 1-1.5 m across and becomes discontinuous with the lagoon on the
majority of tides. The old creek, referred to O, is several meters across
and remains continuous with the lagoon throughout the tidal cycle. The
discontinuity in creek and lagoon water at low tide is important to note
because it indicates that once the lagoon water has fallen below a certain
level on the ebb tide, all remaining water draining from the marsh is trapped
within the creek bottom.
The
ages of the sites were determined by inspection of aerial photographs.
I have defined age as the time since S. alterniflora has been visible
on these photographs, and it is thereby the ecological age of the site.
All of the young sites are the result of the 1962 washover event, and therefore
have the same geological age. The 150+yr site was not affected by the 1962
washover. The age of this site is not known precisely, but it was present
as a marsh on maps dating back to the 1840s (J. Walsh, pers. comm.). It
may be older than 150yr, but it is most likely that it has the same sedimentary
origin, in that the marsh platform was probably lain down by an earlier
washover. Figure 2.3 is a map illustrating the positions of each site.
The two young creeks, hereafter referred to as Y1 and Y2, which are 0.5-.75
m across, become discontinuous with the lagoon after the water has fallen
past a certain level. The intermediate aged creek, hereafter referred to
as I, is 1-1.5 m across and becomes discontinuous with the lagoon on the
majority of tides. The old creek, referred to O, is several meters across
and remains continuous with the lagoon throughout the tidal cycle. The
discontinuity in creek and lagoon water at low tide is important to note
because it indicates that once the lagoon water has fallen below a certain
level on the ebb tide, all remaining water draining from the marsh is trapped
within the creek bottom.
2.2.2 Site instrumentation
At each creek, two-3 m transects were established
perpendicular to the creek. Past studies indicate that the influence of
creekbank morphology on the subsurface hydrological processes does not
extend beyond approximately 2.5 m (Howes et al. 1994, Harvey et al. 1987,
Nuttle 1988, Agosta 1985) to 15m (Nuttle 1988, Nuttle and Hemond 1988)
of the creekbank. Given the small size of these creeks, it is likely that
3 m covers the range of influence. Four sites were established along each
transect at 0-0.5 m, 0.5-1 m, 1-2 m and 2-3 m. Hereafter, the term 'site'
is used to describe each of these distances. Thus,
there are 8 sites at each of the 5 marshes. A suction lysimeter ("sipper",
Chambers & Odum 1990) was placed at 0.5 m, 1 m, 2 m, & 3 m along
each transect. The elevation relative to mean sea level of each sipper
location was determined using Pentax Total Station survey equipment. The
survey was tied in to five benchmarks which are part of the LTER benchmark
system, which was established using Trimble Survey Grade GPS, and is tied
to USGS benchmarks on the mainland. The reference datum is the USGS 1967
reduction level. The overall accuracy of the survey is within 3-4 cm of
the 1967 USGS reduction level, and the within-survey accuracy is 1.5cm
in the z-direction. Figure 2.4 shows the site
instrumentation and the elevations of each site.
2.2.3 Creekbank study
2.2.3.1 Sediment characteristics
Samples for grain size and organic content analysis
were collected in September of 1995. Three replicate 10 cm were cores were
taken from each site and combined. The fractions of sand, silt and clay
present at each sipper site were determined using the method described
in Brower and Zar (1984); the organic content of the sediment was determined
gravimetrically by loss upon combustion. The sediment nitrogen content
was determined in April, June, August and October of 1995 and 1996. One
cm deep cores were taken using a 5cc syringe corer. Three replicate cores
were taken from each site and combined into a single sample. The samples
were lyophilized and ground to homogeneity using a mortar and pestle. Prior
to grinding, shells and large roots and rhizomes were removed. Fine roots
were left in the samples. The nitrogen content was determined using a Carlo
Erba NA1500 Elemental Analyzer. Two replicates were run of each sample
to account for the analytical error of the instrument and the heterogeneity
of the sample.
2.2.3.2 Pore water collection, nutrient and salinity
determination
Pore water samples were collected from the sippers
on a monthly basis from June to October 1995 and April to October 1996.
Prior to collection of pore water, any old water in the sipper was evacuated
using N2 gas to maintain an anoxic environment. A slight vacuum
pressure was applied to the sipper using a hand-pump, and pore water was
allowed to refill the sipper for a few hours. The water was extracted from
the sipper using a syringe. Redox potential (Eh, or platinum electrode
potential), pH, and temperature were determined immediately following collection
by injecting the sample into an anaerobic chamber fitted with Corning electrodes
and a temperature probe attached to a Beckman 12 pH/ISE meter. The measured
redox potential, in millivolts, was adjusted by adding 199mV to correct
for the Ag/AgCl, saturated KCl electrode used. Salinity was measured using
a temperature compensating hand-held refractometer.
Water for NH4+ and PO4-3
analysis was immediately filtered through 0.45m membrane filters into vacutainer
tubes containing 0.1ml 6N HCl, and kept on ice. The acid was added to prevent
the volatilization of NH4+ during the removal of
H2S. The samples were brought back to the field laboratory,
and analyzed within 6 hours. Because H2S interferes in the analysis
of both NH4+ and PO4-3,each
sample was bubbled for 5-10 minutes with N2 gas in order to
drive off the H2S. Immediately prior to pipeting the samples
for analysis and addition of the color reagents, the pH of the samples
was readjusted with 0.1ml 6N NaOH. From time to time the pH of the sample
was tested using a pH meter to ensure that it was in the proper range for
color development. Both NH4+ and PO4-3
were determined spectrophotometrically as described in Grasshoff et al.
(1983). Ammonium was determined by the addition of 0.3 ml each of trisodium
citrate, phenol/nitroferricyanide, and hypochlorite reagents to 5ml of
sample and standard. The samples were incubated in the dark for at least
6hr, and the absorbance was determined on a spectrophotometer at 630 nm.
The pH of the PO4-3 samples was adjusted to 8.0 by
titration with 6N NaOH and 1N H2SO4 using phenolphthalein
as an indicator. One ml of a combined color reagent containing ammonium
molybdate, sulfuric acid, ascorbic acid and potassium antimonyl tartrate
solutions was added to 5.0 ml of sample and standard. Color development
was allowed to proceed for 30 min, and the absorbance was read at 885 nm.
Nitrate + nitrite (hereafter referred to as nitrate)
was analyzed using the method described in Jones (1984). The nitrate in
10 ml of sample was reduced to NO2- by shaking with
spongy cadmium in the presence of 5ml aluminum hydroxide suspension. One
half ml of the color reagent, which consisted of sulfanilimide, N-(1-naphthyl)
ethylenediamine dihydrochloride and phosphoric acid, was added. The color
was allowed to develop for at least 10 min, and the absorbance was read
at 540 nm. The detection limits of this method are 2 mol/l.
Sulfide concentration was determined using a method
described by Cline (1969) as modified by Otte and Morris (1994). Five ml
of unfiltered porewater was added immediately to a vacutainer tube containing
5 ml ZnAc. If necessary, dilutions were made, and 0.4ml N,N-dimethyl-p-phenelynediamine
sulfate + ferric chloride dye was added to each sample and standard. At
least 20 min was allowed for color development, and then the absorbance
was measured spectrophotometrically at 670 nm.
2.2.3.3 Spartina alterniflora production and
tissue element composition
Production was measured at each site in September
1995 and 1996, which is the end of the growing season. At each site three
1/16th m2 haphazardly placed quadrats were thrown.
The species composition was determined, and all of the above ground S.
alterniflora was clipped. The plants were brought back to the laboratory
and frozen until biomass determinations were made. Each plant was cleaned
of sediment and all dead leaves removed. The plant height was measured
to the tallest point (leaf or flower), oven dried and weighed individually.
Using the density and the average weight per plant, the biomass per m2
of marsh surface was calculated.
Spartina alterniflora leaf samples were collected
from each site in June, August and October 1995 and 1996 for tissue element
determination. Ten to fifteen leaves, from different plants, were collected
and combined into a single sample from each site. The leaves were washed
free of sediment, and stored in a freezer. The samples were lyophilized,
and ground to homogeneity using a Krups coffee mill. The carbon and nitrogen
composition of the tissue was analyzed using a Carlo-Erba NA1500 Elemental
Analyzer. Three replicates of each sample were run in order to assess the
analytical error of the instrument and the homogeneity of the samples.
2.2.3.4 Data analysis
Between marsh comparisons were made using SPSS General
Linear Model - General Factorial function. When significant differences
were found between marshes, post hoc tests were run. When variances were
equal, Tukey's HSD was used; when variances were unequal, the Games-Howell
test was used. A Principal Components Analysis was run on the variables
shown in Table 2.1 using SPSS. Between and within marsh comparisons were
made on the factor scores generated by the PCA using SPSS General Linear
Model - General Factorial function.
2.2.4 Tidal cycle study: creek water collection
and analysis
Creek water was sampled on two spring tides (14 July
& 23 August, 1995) and two neap tides (16 September and 15 October,
1995). Samples were collected from each creek and the flooding lagoon at
hourly intervals over an entire tidal cycle (12 hr) on each date. Salinity
and pH were measured as described above. Particulate carbon and nitrogen
were measured by filtering water through 13 mm pre-combusted glass fiber
filters. The filters were inserted into tin capsules, dried at 60C, and
analyzed using a Carlo-Erba NA1500 Elemental Analyzer. Particulate matter
was determined by filtering creek water through pre-weighed, pre-combusted
47 mm glass fiber filters. The filters were dried at 60C and weighed. The
filters were then combusted at 450C for 6 h, and weighed again to obtain
the percent organic content of the particulate matter. Nutrient samples
were filtered as described for the porewater samples, and stored in 35
ml brown Nalgene bottles on ice. The samples were analyzed for NH4+,
NO3- and PO4-3 as described
above. Data from the 4 tidal cycles were pooled, and averages were made
at hourly intervals based on the time since high tide.
2.3 RESULTS
The lagoon site was scoured considerably during the
winter of 1995-96. Destruction of the below-ground S. alterniflora
biomass was evident in the early spring of 1996, and there appeared to
be elevational changes. In addition, following the establishment of this
site, we found that the old marsh, which was buried in 1962, was only about
15 cm below the surface of the newly established marsh. Following the winter,
it was even closer to the surface. This marsh seemed to be supplying high
concentrations of PO4-3 to the porewater here. In
addition, at the sites 0.5 m from the edge of the lagoon, the redox potential
was very low, most likely due to the degradation of organic matter in the
buried marsh. For these reasons, this marsh was not included in the majority
of the data analyses presented here. It was, however, used in the PCA so
that a marsh which develops in the absence of a creek can be compared with
those that have creeks.
With the exception of salinity, there were no significant
differences between months, or years, so data for all months were pooled.
Figures describing all data monthly, by year, can be found in Appendix
A. The comparisons presented for all creekbank variables will be two-fold:
(1) the means for each marsh and the associated statistical differences
are presented on one figure, and (2) values based on distance from the
creek for each marsh; these are presented as a separate figure.
2.3.1 Creekbank study
2.3.1.1 Porewater chemistry
The porewater chemistry is presented in Figures 2.5,
2.8 and 2.9. Porewater
salinity was higher in August and September, most likely due to the increased
ET resulting from higher temperatures and greater S. alterniflora
biomass. As illustrated in Figure 2.5A there is
no difference in salinity between I and O, but there is a significant 10ppt
difference between Y1 and Y2. This difference is evaluated in the following
chapter. There is a positive relationship between the salinity and the
distance from the creek in all marshes (Figure 2.8A).
There is no trend either between (Figure 2.5D)
or within (Figure 2.8B) marshes for temperature.
The mean pH at Y2 is 6.6, and at all other sites it is ~6.9. The reason
for this is unknown. There is no difference in redox potential between
Y1 and Y2, and between I and O, however these two groupings are significantly
different from each other. In the two young marshes, there is an increase
in Eh with distance from the creek, and in the older marshes the maximum
Eh appears at 1 m from the creek (Figure 2.8C).
In the two young marshes the redox potential appears to increase with distance
from the creek. The sulfide concentration in the old marsh is inversely
related to the redox potential, and is highest where the redox is lowest,
further from the creek.
Mean ammonium concentration (Figure
2.5E) increases with age. There does not appear to be a trend associated
with the location within each marsh (Figure 2.9A).
Nitrate is consistently low (<3 M), and is only significantly different
between the two youngest marshes, and the two older marshes (Figure
2.5F). However, most of these values are below the limits of detection,
and these results should be treated accordingly. PO4-3
is lowest at Y2, intermediate at Y1, and is highest at I and O, as shown
in Figure 2.5G. Thus there appears to be a significant
trend with age. In the youngest marshes there appears to be a trend of
decreasing P with increasing distance from the creek, but it is slight
(Figure 2.9C). There is no apparent trend in the
older marshes.
2.3.1.2 Sediment characteristics
Figure 2.6 shows the mean
values of the sediment characteristics for each marsh. For all variables
there is no significant difference between Y1 and Y2, while I and O are
each significantly different from all others. These variables all show
a distinct trend with age: decreased elevation, decreased sand, increased
silt, clay, organic matter, and nitrogen. In Figure
2.10A it can be seen that the % organic matter is positively associated
with increasing distance from the creek edge in the old marsh, and negatively
associated in the younger marshes. Figure 2.10E
shows that there is also an inverse relationship with %N and increasing
distance from the edge, for all marshes.
2.3.1.3 Spartina alterniflora production
Figure 2.11 shows the S.
alterniflora above ground primary production, density, and plant characteristics
for each marsh, with respect to the distance from the creekbank. In all
three of the immature marshes, the biomass per m2 and the average
weight per plant drops off with increasing distance from the creek. This
trend is not observed in the old marsh. Overall, at 0.5m from the creekbank
Y1 had the highest biomass (1689.3 g/m2), and the highest weight
per plant (3.2 g/plant), and I had the greatest density (695 plants/m2).
Height decreases with distance in Y1 and Y2, but remains constant in I
and O. There does not appear to be a difference in sexual reproduction
(percent of plants flowering) with respect to the distance from the creekbank.
Figure 2.7 shows the mean production characteristics
for each marsh, and indicates where significant differences exist between
marshes. The mean biomass for all distances are 805.8, 270.4, 956.8 and
976.9 g/m2 for Y1, Y2, I & O, respectively. In general,
it appears that biomass increases with age, but only Y2 is significantly
different from the others. The very high production at Y1 - 0.5 m causes
the grand mean for that marsh to be very high. Overall, Y2 has significantly
lower biomass, plant weight, and plant height when compared to all other
marshes. The old marsh has the tallest plants, and these plants are more
likely to be sexually reproducing. Even though the two young marshes are
approximately the same age, there is a significantly greater biomass at
Y1. The only difference in porewater chemistry between these two sites
is salinity. The elevated salinity at Y2 may have a detrimental effect
on S. alterniflora growth (Phleger 1971). The cause of this variation
in biomass, which is attributed to the difference in the subsurface hydrology
at these two sites, is the subject of the next chapter.
2.3.1.4 Spartina alterniflora tissue element
composition
The relationships between the S. alterniflora
tissue element composition and the distance from the creekbank are shown
in Figure 2.12, and the mean values for each
marsh are shown in Figure 2.7. As illustrated
in Figure 2.12, there does not appear to
be any relationship between %C and distance. However, for all marshes there
is a decrease in %N, and a contemporaneous increase in C:N for plants growing
farther from the creek. Figure 2.7 shows that
the overall the mean %N increases significantly with age, the %C decreases,
although not significantly, and the C:N decreases significantly with age.
Thus, in an older marsh, there is a greater amount of above ground nitrogen
both per gram of plant tissue, and overall, which is due to the higher
biomass.
2.3.1.5 Principal components analysis
The principal components analysis resulted in 3 significant
principal component vectors. The first one of these (PC1) explains 42.1%
of the variability in the data set, and is the only one that will be discussed.
The factor loadings associated with each variable are shown in Table 2.1.
This principle component is associated primarily with sediment characteristics,
although S. alterniflora characteristics are moderately important,
and nutrients and pore water sulfide and Eh are associated as well. In
the positive direction, PC1 is associated with an increase in organic matter,
sediment carbon, sediment nitrogen, silt and clay, and a decrease in sand
and elevation. PC1 is also associated with plant height and % flowering,
and to a lesser extent to biomass and plant weight. In addition, high factor
scores are associated with a high N content and low C:N in plants. Finally,
there is a modest relationship between porewater ammonium, phosphate, sulfide
and redox potential. All of these characteristics have previously been
associated with older marshes, and there is a significant relationship
between PC1 and age (r2=0.92, p<0.001). The mean factor scores
for each site are -0.56, -0.84, 0.22, and 1.78 for Y1, Y2, I and O, respectively.
See Figure 2.13A. These values are all significantly
different from each other, indicating that this principal component explains
the variability associated with different ages, even though age was not
used as a variable. The lagoon site was included in the PCA in order to
assess the aging process in a marsh without a creek. The mean factor score
for this marsh was -0.59. Figure 2.13B also shows
the relationship of the mean factor score for each site to the distance
from the creekbank. For the lagoon site
| variable type
|
variable
|
factor
loading
|
| sediment
|
% N
|
.94
|
| characteristics
|
% sand
|
-.93
|
|
|
% organic matter
|
.93
|
|
|
elevation
|
-.92
|
|
|
% silt
|
.91
|
|
|
% clay
|
.89
|
| porewater chemistry
|
NH4+
|
.59
|
|
|
Eh
|
-.46
|
|
|
PO4-3
|
.43
|
|
|
S-2
|
.40
|
|
|
NO3-
|
-.27
|
|
|
pH
|
.17
|
|
|
temperature
|
.06
|
|
|
salinity
|
.03
|
| Spartina alterniflora
|
plant height
|
.80
|
| characteristics
|
% flowering
|
.73
|
|
|
% N
|
.72
|
|
|
C:N
|
-.71
|
|
|
plant weight
|
.69
|
|
|
biomass
|
.63
|
|
|
density
|
.20
|
|
|
% C
|
-.11
|
Table 2-1. Variables used in the Principal
Components Analysis, and the factor loadings associated with each variable
for principle component 1 (PC1). Variables within each type are ordered
in descending factor loading.
and the old marsh, there is no pattern in factor
scores with respect to the distance from the creek bank. However, in the
immature marshes, there are significant differences. In all cases, the
factor score, which can be taken as a proxy for the ecological or successional
maturity of the site, increases as one approaches the creek. It follows,
therefore, the marsh is more mature closer to the creekbank, than further
away from the creekbank. For example, the mean factor score at Y1 - 0.5
m is the same as the mean factor score at I - 3 m, indicating that these
two marshes have a similar functional maturity.
2.3.2 Tidal cycle study
2.3.2.1 Creek water chemistry
Figure 2.14 shows the pH
and salinity in the creeks and in the adjacent lagoon over the tidal cycle.
The concentration in the lagoon is shown in each plot for comparison purposes.
In all but Y2, the salinity remains fairly close to the salinity of the
lagoon. Y2 has salinities of 50 - 60 ppt at low tide, perhaps indicating
that salty water is being discharged into the creek. The pH of the lagoon
exhibits a slight depression around low tide, and all of the creeks exhibit
a large depression in pH at low tide. The two youngest creeks show the
greatest reduction in pH at low tide. The nutrient concentration in the
creeks is shown in Figure 2.15. While the nutrient
concentrations in the lagoon and the old creek remain relatively constant
over the tidal cycle, the three developing marshes show a marked increase
in ammonium and phosphate concentration during the falling tide. Nitrate
concentration is too low in all of the creeks to indicate any trend.
2.3.2.2 Creek water particulate matter
The concentration of particulates remained low in
the lagoon and the old creek over the tidal cycle, with the exception of
a single point in the old marsh (Figure 2.16A).
Although there is a great deal of variability, the concentration of particulates
in the younger creeks does appear to increase as the tide ebbs. As shown
in Figure 2.16B, the organic content of the suspended
matter increases as the tide ebbs in the younger marshes. Figure
2.17 shows the concentration of particulate N and particulate C in
the creek water as a functional of the tidal cycle. Again, there is a great
deal of variability in the data, but there does appear to be an increase
in the concentrations of C and N in the younger creeks as the tide falls.
In Y1 it looks as if the C:N of the particulate matter is higher as the
tide is falling. Perhaps this indicates an increased deposition of undegraded
organic matter into the creek from the marsh surface. Overall, it can be
stated with some certainty, that as the tide falls in these young creeks
there is an increase in the concentration of particulate matter. This could
be explained by undegraded plant material being flushed from the marsh
surface into the creek as the tide goes out. It is likely that further
degradation of this material takes place while it is in the creek.
2.4 DISCUSSION
2.4.1 Patterns associated with succession
As discussed previously, succession is considered
to be an orderly and predictable process. The first goal of this study
is to establish that succession is indeed occurring, even in the absence
of a true 'succession' of species. In this natural experiment, where we
have a space for time substitution, there are clearly general patterns
associated with the increasing age of the marsh. These patterns are shown
in Figure 2.13C. Thus, even though there is not
a change in the plant community, there are predictable changes in the physico-chemical
variables measured in this marsh. In general, for most of the variables
that are associated with age, Y1 and Y2 tend to be grouped together. For
the sediment characteristics, I is at an intermediate stage between the
young marshes and the older marsh. However, for NH4+,
I groups with the young marshes, and for PO4-3 it
groups with the old marsh. Thus, it appears that different variables reach
their 'mature' levels at different points in the aging process.
While the biomass of S. alterniflora is not
clearly associated with age, there are other characteristics of these plants
that do appear to be related to the age of the marsh. In an older marsh
the plants are taller, which is perhaps a response to light limitation
imposed by the longer tidal inundation time. In addition, in an older marsh
the plants have a significantly higher N content than younger marsh plants.
Finally, plants in an old marsh are more likely to reproduce sexually relative
to plants in a young marsh. It is unknown whether there is a difference
in the clonal reproduction between young and old marshes. However, it is
possible to infer that there is a difference in the strategy of reproduction.
Plants in a young marsh are putting more effort into rhizomal reproduction
as opposed to seed production, and the reverse is true in an old marsh.
If this is the case, this would in a sense, contradict the idea presented
by Odum (1969) that r-strategists compete well at earlier successional
stages but K-strategists dominate in later successional stages. However,
Odum is referring to interspecific competition, while this example
illustrates intraspecific competition. Further research is necessary
in order to draw any conclusions about the reproductive strategy of these
plants. However, the physical and physiological variation present in this
species over the chronosequence is evidence that although the species composition
doesn't change, the "physiology, habits, behavior [and] mode of life" (Shelford
1911) do change.
It is necessary to clarify that the patterns described
herein are those observed at the creekbank of each of these marshes. While
it is possible to assume that similar patterns will be observed within
the interior of the marsh, caution must be taken in creating overly generalized
theories of marsh succession from these results.
2.4.2 Processes associated with successional
patterns
The presence of plants on the marsh surface can be
linked to many of the increases in sediment and porewater characteristics
that exhibit changes over time. Figure 2.1 below illustrates these processes. 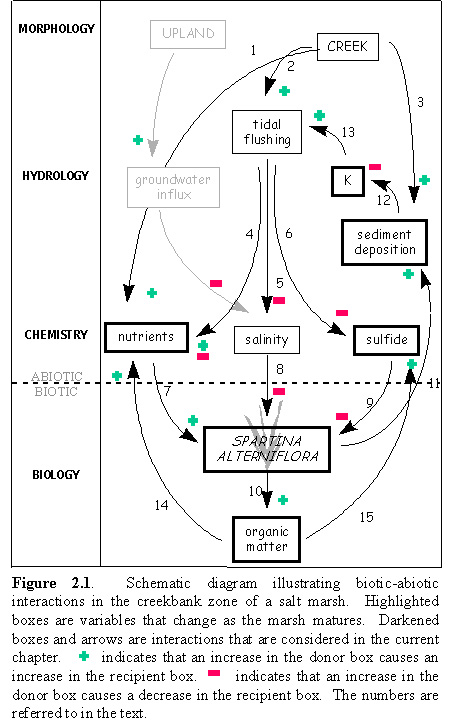 First,
S. alterniflora acts to trap sediments that are brought in by the
tides (arrow 11). This will lead to an increase in the silt and clay content
of the sediment, and lead to a simultaneous decrease in the sand content.
This change in the relative proportions of grain size fractions will result
in a decrease in the hydraulic conductivity of the sediment (arrow 12).
With a lower conductivity, fewer nutrients will be leached out of the sediment
on a falling tide (arrow 13). Over time, S. alterniflora will contribute
organic matter to the sediment in the form of wrack, and dead roots and
rhizomes (arrow 10). This is likely the cause of the increase in organic
matter, as well as the increase in the N content of the sediment. The presence
of increasing amounts of reduced organic matter in the sediment will cause
a reduction in the redox potential in the sediments and will also lead
to anaerobic degradation pathways, which in turn will lead to an increase
in the H2S concentration in the sediment (arrow 15). The remineralization
of this organic matter will also lead to an increase in N and P in the
porewater (arrow 14); as mentioned above, fewer of these nutrients will
be lost due to a decreased flushing of the system (arrow 4, negative feedback).
The increase in N and P will promote additional S. alterniflora
growth. Thus, there is a positive feedback between biotic (S. alterniflora
production and decomposition) and abiotic factors (sediment accumulation)
which acts to accelerate the rate at which a marsh appears older. This
type of feedback loop will continue until the quantity of reduced carbon
in the sediment leads to a sufficiently low redox potential that it interferes
with the plants ability to function through inhibition of N uptake (Morris
& Dacey 1984) and sulfide toxicity (DeLaune et al. 1983 ).
First,
S. alterniflora acts to trap sediments that are brought in by the
tides (arrow 11). This will lead to an increase in the silt and clay content
of the sediment, and lead to a simultaneous decrease in the sand content.
This change in the relative proportions of grain size fractions will result
in a decrease in the hydraulic conductivity of the sediment (arrow 12).
With a lower conductivity, fewer nutrients will be leached out of the sediment
on a falling tide (arrow 13). Over time, S. alterniflora will contribute
organic matter to the sediment in the form of wrack, and dead roots and
rhizomes (arrow 10). This is likely the cause of the increase in organic
matter, as well as the increase in the N content of the sediment. The presence
of increasing amounts of reduced organic matter in the sediment will cause
a reduction in the redox potential in the sediments and will also lead
to anaerobic degradation pathways, which in turn will lead to an increase
in the H2S concentration in the sediment (arrow 15). The remineralization
of this organic matter will also lead to an increase in N and P in the
porewater (arrow 14); as mentioned above, fewer of these nutrients will
be lost due to a decreased flushing of the system (arrow 4, negative feedback).
The increase in N and P will promote additional S. alterniflora
growth. Thus, there is a positive feedback between biotic (S. alterniflora
production and decomposition) and abiotic factors (sediment accumulation)
which acts to accelerate the rate at which a marsh appears older. This
type of feedback loop will continue until the quantity of reduced carbon
in the sediment leads to a sufficiently low redox potential that it interferes
with the plants ability to function through inhibition of N uptake (Morris
& Dacey 1984) and sulfide toxicity (DeLaune et al. 1983 ).
The factor scores from the principle components analysis
can be used as a proxy for the maturity of the marsh, and can used to gauge
the rate of succession at each site. Using these factor scores, it appears
that in terms of the functional maturity of the marshes, or the successional
"age", the sequence is: Y2, L, Y1, I and O, from youngest to oldest (Figure
2.13A). Y2, which has lower S. alterniflora production due to
elevated salinity, has a limited capacity to participate in the biotic-abiotic
feedback loop described above. Y1, on the other hand, has depressed salinities,
and higher production. This higher production allows for greater biotic-abiotic
interactions, which thereby accelerates the aging process. While these
two marshes have the same ecological age, it is evident that there are
other factors (e.g. the salinity) that are controlling the relative rate
of succession.
2.4.3 Spatial patterns and processes at the
creekbank
The production in the region closest to the creekbank
in the young marshes is higher than further from the creek. Osgood (1996)
postulated that in younger marshes, the hydraulic gradient established
by the sloping surface characteristic of these marshes acts to supply plant
roots with a greater supply of nutrients over time than is apparent in
the porewater at any one time. In the vicinity of the very young creeks
on Hog Island the porewater nutrient concentration is very low, and does
not appear that it should be able to support the plant biomass measured
there. However, the hydraulic gradient set up by the creek may act to augment
the supply of nutrients to these plants (arrows 2 and 4 in Figure 2.1).
The hydraulic gradient also acts to increase the flushing out of salts
and toxins (arrows 5 and 6). The higher biomass at the creekbank intimates
that there will be greater sediment deposition and greater organic matter
contribution to the sediment. Thus, even within a single marsh the magnitude
of the biotic-abiotic feedback processes varies spatially. As described
above, these feedback processes lead to an acceleration of the rate of
succession, and it can be suggested that succession is occurring more rapidly
closest to the creekbank. Again, using the results of the PCA as a proxy
for marsh maturity, in the young marshes the region closest to the creekbank
does appear to be more functionally mature because it has a higher mean
factor score (Figure 2.13B). In the lagoon marsh,
there is no trend in the factor scores with relation to the edge of the
marsh. This makes it appear that the creek is important in determining
the spatial patterns of functional maturity. Thus, the landscape, or geomorphology
of the region acts to facilitate the successional process. In addition,
there are processes associated with the creek itself that act to accelerate
the maturation of the marsh in the immediate vicinity of the creek.
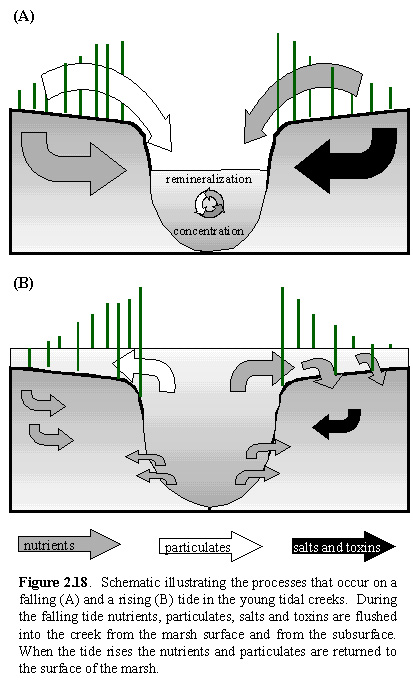
2.4.4 Processes within the creek
It appears that as the tide is falling, nutrients
are being leached out into the creeks. There was a slight difference in
this effect between neap and spring tides. It has been noted that spring
tides generally have higher nutrient concentrations than neap tides (Vorosmarty
& Loder 1994); however, given that the spring tides, which did have
higher concentrations, were sampled during July and August, it is likely
that the higher temperatures resulted in greater evaporation from the creeks.
As the tide falls, nutrients and salts are leached out of the sediment
and into the creeks. Given the higher elevation and higher hydraulic conductivity
of the sediments in vicinity of the young creeks, it is likely that more
water, and hence more nutrients will be lost per unit area of creekbank
in younger compared to older marshes (Harvey et al. 1987, Howes et al.
1994). These processes correspond to arrows 2 and 4 in Figure
2.1. However, once the tide is lower than the creek bottom, all further
leachates are trapped in the creek bottom. This is true for all material
that is washed from the surface of the marsh as well. These processes are
shown schematically in Figure 2.18A.
According to general theories of ecosystem development,
young ecosystems are inherently leaky (Odum 1969, Vitousek & Reiners
1980). As an ecosystem matures, it has more developed biogeochemical cycling
such that it only loses what it can afford to lose. Given the observed
concentrations of particulates and nutrients found in the young creeks
on Hog Island, it appears that these young systems are leaky. It
is unknown what quantity of nutrients and particulates is lost from the
older marsh because dilution takes place in this large creek. In the past
two decades, ideas regarding marshes as a source or a sink of nutrients
and particulates to the surrounding estuaries have been extensively examined
(e.g. Redfield 1972, Wolaver & Spurrier 1988, Wolaver et al. 1988,
Dame et al. 1992, Dame & Gardner 1993, Childers 1994). Childers (1994),
in a review of a number of studies on the flux of materials between marshes
and estuaries, concluded that in systems where the tidal range is greater
than 1m, young marshes take up nutrients and organic matter from the flooding
water at greater rates than more mature marshes. The tidal range on Hog
Island is 1.3 m.
At low tide, the nutrients and particulates are trapped
within the small creeks because no further drainage into the lagoon occurs.
Within the creek, the nutrients are concentrated due to evaporative processes,
and further degradation of organic particulates can take place in this
nutrient rich environment. As the tide rises, the nutrients and particulates
are brought back up over the surface of the marsh, where the nutrients
become available for uptake by plants, and the particulates are deposited
on the surface of the marsh. Figure 2.18B illustrates
these processes. These processes correspond to the arrows labeled 1 and
3 in Figure 2.1. Thus, although these systems are "leaky", there does not
appear to be an effective loss of nutrients through the creekbank, or particulates
over the surface. Reed (1988) discussed that creeks can serve as a temporary
storage trap for particulates: the particulates are held within the creeks
during "normal" tides, and returned to the marsh on exceptionally high
tides. This would indicate that this process of returning nutrients and
particulates does not necessarily occur during every tide, but does occur
on exceptionally high tides and on tides with a greater flooding velocity.
The young creeks are functional structures whereby nutrients and organic
compounds are retained within the system.
Given the sediment organic matter distribution, it
appears that the particulates are predominantly deposited close to the
creekbank. Movement further towards the interior of the marsh is probably
impeded by the S. alterniflora stems. That being the case, the organic
content and grain size of the region closest to the creek bank that is
vegetated will begin to attain values characteristic of an older marsh
more rapidly than areas further towards the marsh interior. Additionally,
the increase in organic matter, and the concentration of nutrients in the
creek bottom, and subsequent return of these materials to the marsh closest
to the creek will act to 'fertilize' this portion of the marsh. Thus, the
creek acts to supply nutrients to the plants indirectly, as previously
discussed by (1) increasing the flow past the roots, and (2) increasing
the plants' capacity for uptake, and directly, by concentrating the nutrients,
and returning them to the surface of the marsh.
2.4.5 Conclusions
There are predictable trends that take place in a
salt marsh as it ages. There is the transition from a sandy substrate to
a more highly organic, muddy substrate. The porewater becomes enriched
in nutrients, and the sulfide concentration increases. The overall biomass
increases, and the plants exhibit different reproductive patterns, and
tissue element compositions. Thus, a varietal form of succession, although
not the classical one, does occur in these marshes. The rate at which this
succession occurs seems to vary spatially within the marsh; the highest
rates are closest to the creekbank. There seems to be a positive feedback
between the differential geomorphology associated with the creekbank, which
acts to promote S. alterniflora growth, and the rate of development
of the marsh. In addition, the hydrological processes within the creek
itself, which are associated with the rising and falling of the tides,
act to accelerate the development of the marsh by preventing the loss of
nutrients and particulates.
There are some potential limitations to the applicability
of this study to other systems. First, this is a back-barrier marsh. The
sedimentary and geological history is different than other types of marshes,
and these marshes are much less expansive than typical mainland marshes.
Second, the 'space-for-time' substitution provided by this chronosequence
requires the assumption that all of these marshes are following the same
successional pathway, and are developing at similar rates. While they may
be following the same pathway, the rates of development are clearly unequal.
This is shown by the difference in the functional 'maturity' (as defined
by the PCA) between Y1 and Y2. While these marshes have the same ecological
age, there are factors external to the marsh proper, such as the properties
of the catchment of which they are a part of, which leads to a difference
in macrophyte biomass. At Y2, the interaction between the biotic and abiotic
factors, or the "reaction", which defines the successional process, is
diminished, and thus the rate of maturation is likewise diminished. Thus,
although the successional process initiated at the same time, the two systems
have not progressed identically.
Despite the idea that not all young marshes are 'created
equal', there does appear to be a general pattern of process associated
with succession which depends on the geomorphology of the system. The tidal
creeks on Hog Island act to accelerate the aging process in the vicinity
of the creek. The creeks act to prevent the loss of nutrients and particulate
organic matter from the marsh by trapping them in the creek bottom. The
marsh is then fertilized with these nutrients. This factor, along with
the creation of a lower salinity, higher oxygen environment, leads to increased
S. alterniflora production. Through the biotic-abiotic feedback
loops discussed above, increased production leads to an increased rate
of marsh maturation. The marsh becomes functionally more mature in areas
where the production is higher. In this fashion, a small chronosequence
is developed at the edge of the creek, and the marsh spreads from the creekbank
outwards.
2.4.6 Implications
Salt marshes are an important ecological and economic
resource (Lugo & Brinson 1979). In recent years, there has been an
increase in efforts to restore and create marshes for mitigation of destroyed
marshes. Understanding the patterns and processes associated with marsh
development is crucial to planning successful restoration efforts. As discussed
by Mitsch and Wilson (1996), one of the greatest needs in wetland mitigation
projects is a better understanding of wetland function. Many mitigation
projects fail because of a lack of communication between the engineers
who design and restore wetlands and the ecologists who study them. In an
evaluation of the function of a restored marsh, Moy and Levin (1991) suggested
that increased creek frontage may have increased the utilization of the
marsh by macrofauna. This study suggests that in a naturally developing
marsh the creekbank plays an important role in enhancing both primary production
and the rate of succession. In addition, these small creeks help to retain
nutrients within the system. If, indeed, tidal creeks do accelerate the
formation of a mature marsh, restoration could be designed such that the
ratio of creek bank to marsh interior will maximize the rate of marsh development.