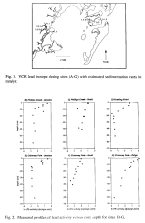
 Figure 1 and Table 1. Cores were collected
32.5m from the marsh edge. Measured compaction for all cores was less than
3% of the core length. Cores were sectioned into 2cm intervals. Subsamples
from selected intervals were dried, ground and passed through a 500um sieve
to remove large pieces of vegetation. Subsamples were sent to Dr. Jeff Cornwell
at Horn Point Environmental Laboratory for lead isotope analysis.
Figure 1 and Table 1. Cores were collected
32.5m from the marsh edge. Measured compaction for all cores was less than
3% of the core length. Cores were sectioned into 2cm intervals. Subsamples
from selected intervals were dried, ground and passed through a 500um sieve
to remove large pieces of vegetation. Subsamples were sent to Dr. Jeff Cornwell
at Horn Point Environmental Laboratory for lead isotope analysis.The resulting profiles of lead activity are given in Figure 2 for sites B-F; site A was a study site of Barr (1989, MS Thesis, Dept. of Env.Sci., Univ. of Virginia). Over the depth range of decreasing lead activity, the natural log of the activity was regressed against depth. The slope of the regression yields the estimated sedimentation rates for sites B-F given in Table 1 and indicated on Figure 1; the rate for site A is taken from Barr (1989). These results are preliminary pending consultation with Jeff Cornwell concerning details of the method used to compute the sedimentation rates.
Table 1. Preliminary sedimentation rates from lead isotope dating
-----------------------------------------------------------------
Site Description			       Sedimentation rate
						     (mm/yr)
-----------------------------------------------------------------
Phillips Creek Marsh
 A Barr (1989) site (headwater)			       1.1
 B Kastler site (upstream)			   1.0-1.4
 C Robinson site (near mouth)			   0.2-0.3

Fowling Point Marsh
 D Robinson site				   1.4-1.7

Chimney Pole Marsh
 E Kastler site (west edge)			   1.5-2.0
 F Robinson site (on the Straits)		       0.5
 G Ridge site (low marsh on creek west of ridge)   1.0-1.3
-----------------------------------------------------------------