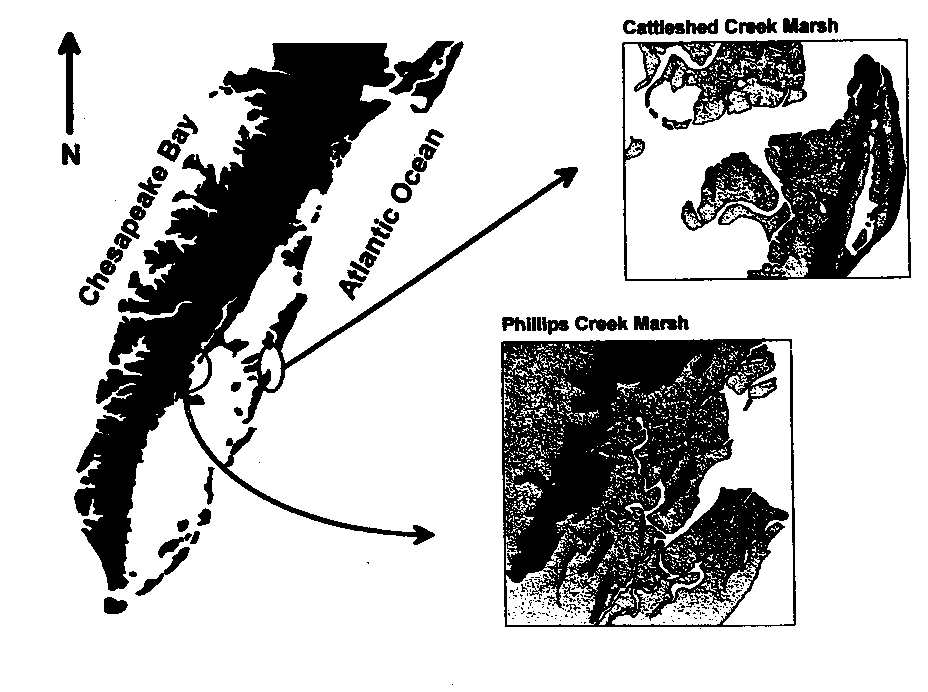
 Figure 2.1 Map of the lower Delmarva peninsula and marsh study areas.
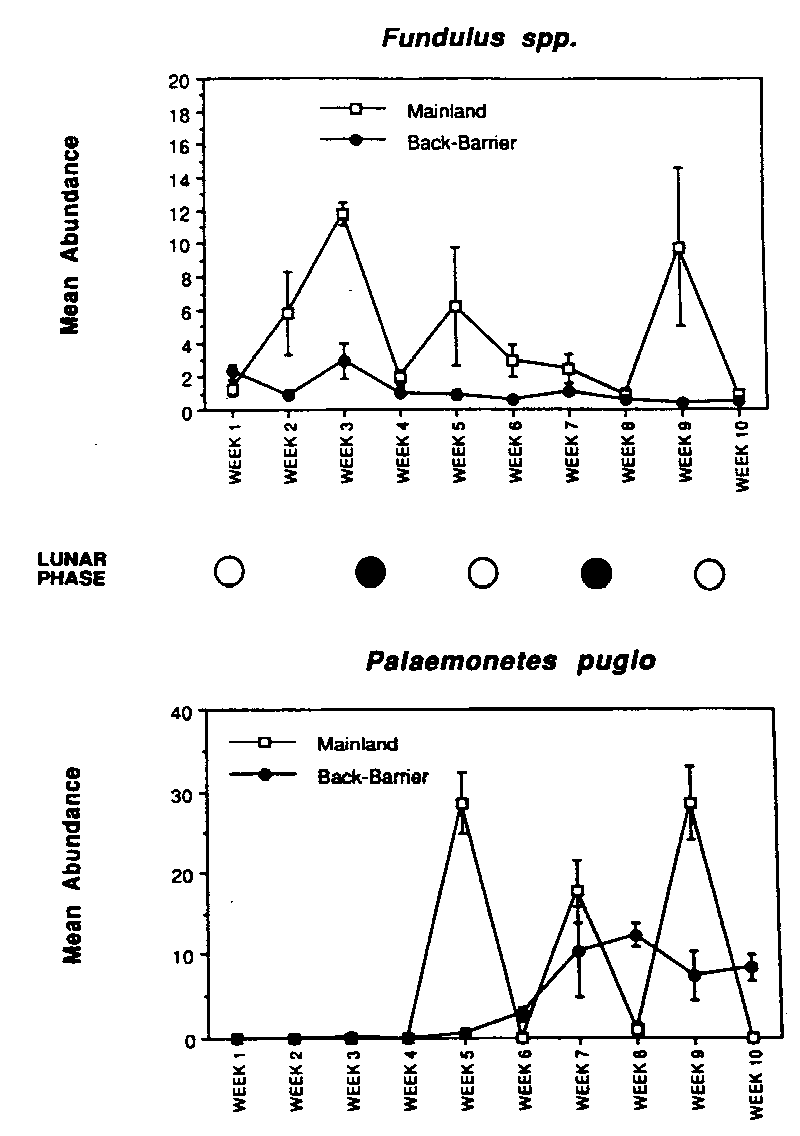 Figure 2.2 Mean weekly abundance of fishes (Fundulus spp.) and Decapods
(Palaemonetes pugio) on the surface of mainland and back-barrier marsh
study sites; June 10 - August 15, 1991.
Figure 2.2 Mean weekly abundance of fishes (Fundulus spp.) and Decapods
(Palaemonetes pugio) on the surface of mainland and back-barrier marsh
study sites; June 10 - August 15, 1991.
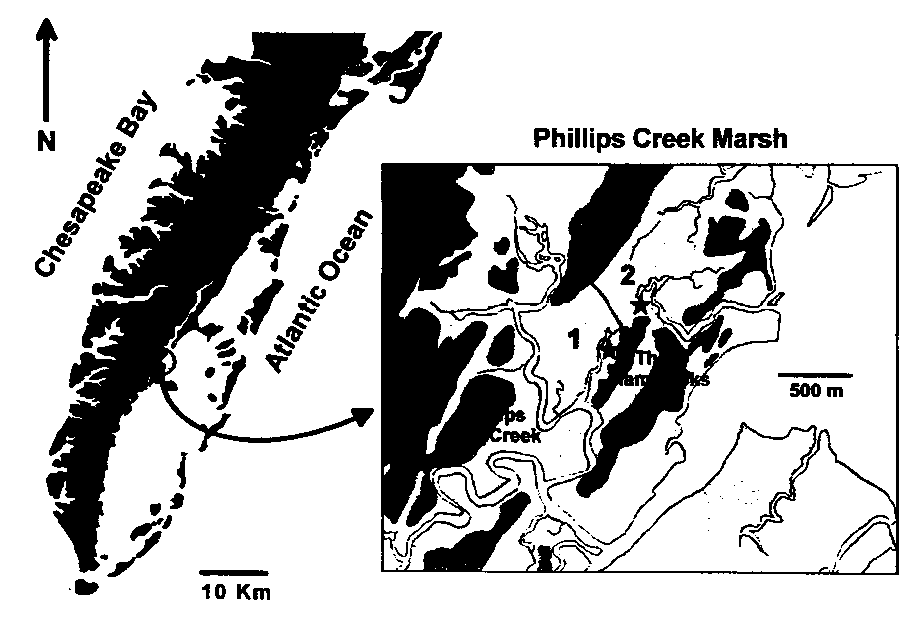 Figure 3.1 Map of the lower Delmarva peninsula and marsh study areas.
 Figure 3.2 Mean monthly abundance of Fundulus heteroclitus on the
surface of Hammocks marsh and Phillips Creek marsh; April - November, 1992.
Figure 3.2 Mean monthly abundance of Fundulus heteroclitus on the
surface of Hammocks marsh and Phillips Creek marsh; April - November, 1992.
 Figure 4.1 Sampling design showing heirarchy of three environmental variables
(marsh topography, flooding regime, and location along a salinity gradient).
Figure 4.1 Sampling design showing heirarchy of three environmental variables
(marsh topography, flooding regime, and location along a salinity gradient).
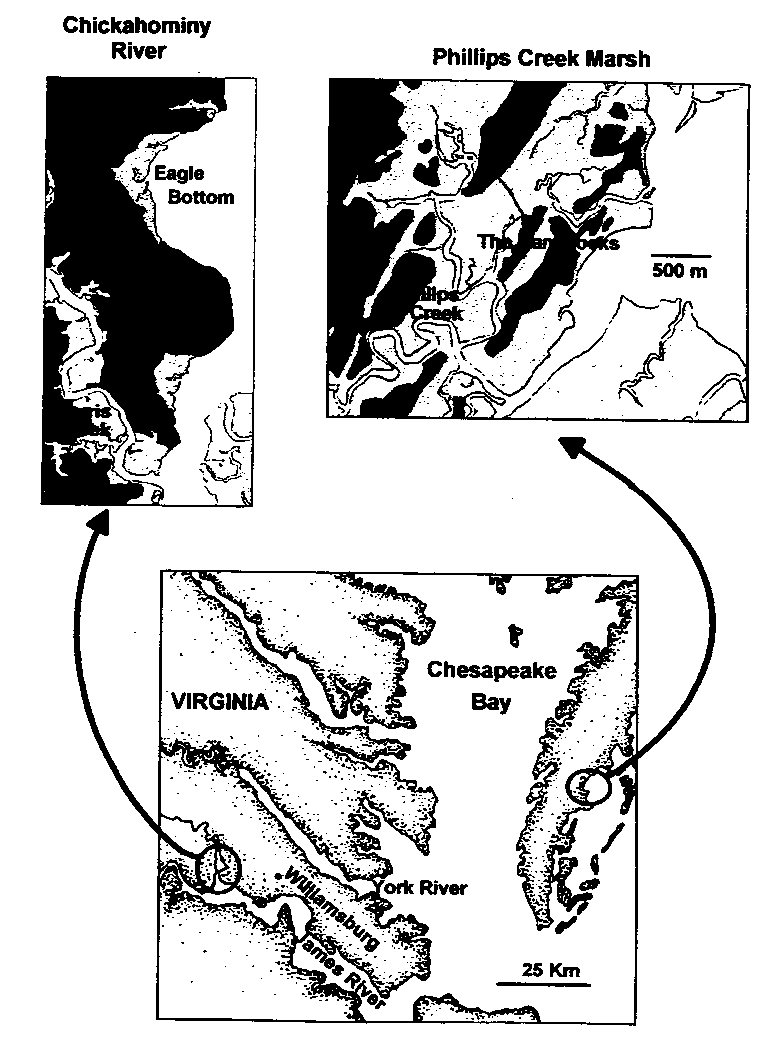 Figure 4.2 Map of study area showing tidal freshwater and salt marsh study
sites.
Figure 4.2 Map of study area showing tidal freshwater and salt marsh study
sites.
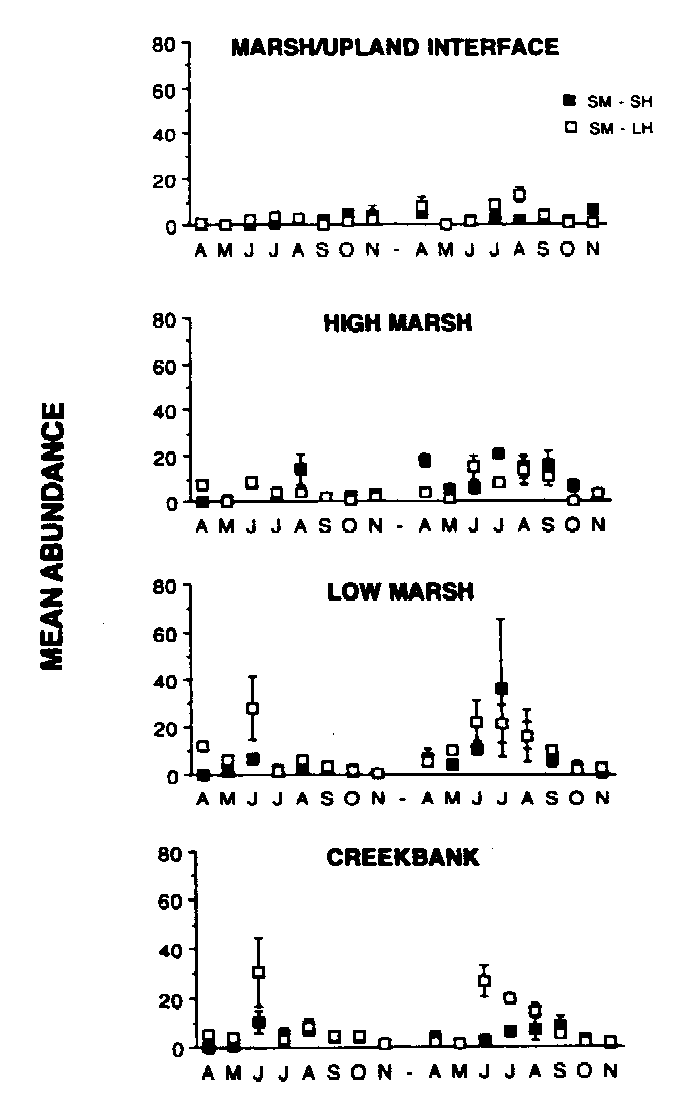 Figure 4.3 Mean abundance of fishes on the surface of Phillips Creek Marsh (salt
marsh; short hydroperiod) and Hammocks Marsh (salt marsh; long hydroperiod);
April - November, 1992 and 1993.
Figure 4.3 Mean abundance of fishes on the surface of Phillips Creek Marsh (salt
marsh; short hydroperiod) and Hammocks Marsh (salt marsh; long hydroperiod);
April - November, 1992 and 1993.
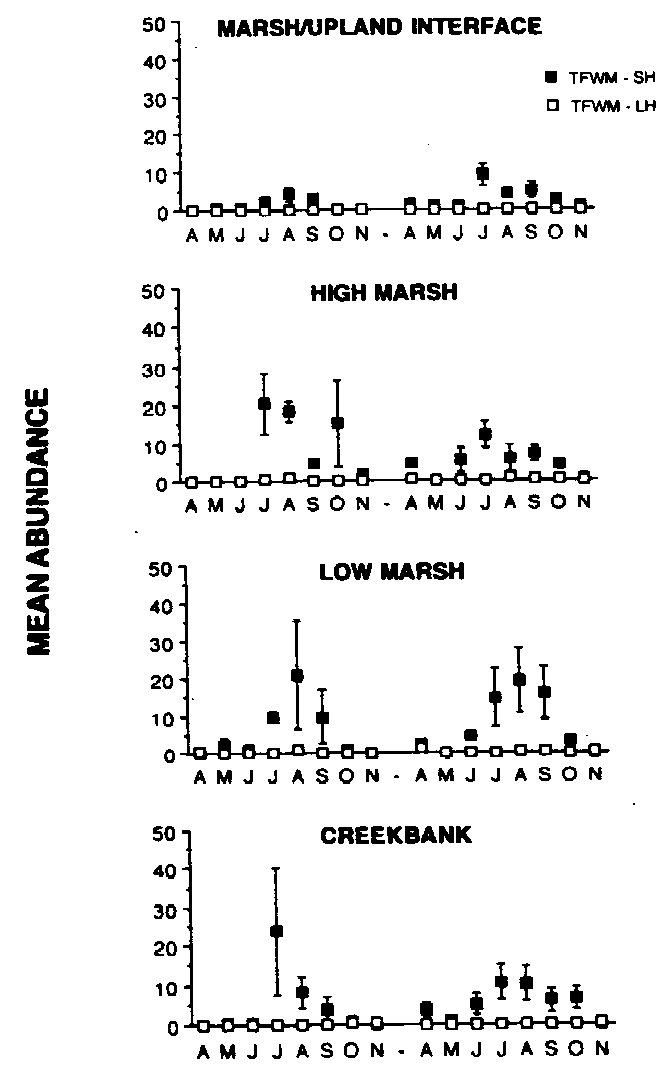 Figure 4.4 Mean abundance of fishes on the surface of Beaver Dam Creek Marsh
(tidal freshwater marsh; short hydroperiod) and Eagle Bottom Marsh (tidal
freshwater marsh; long hydroperiod); April - November, 1992 and 1993.
Figure 4.4 Mean abundance of fishes on the surface of Beaver Dam Creek Marsh
(tidal freshwater marsh; short hydroperiod) and Eagle Bottom Marsh (tidal
freshwater marsh; long hydroperiod); April - November, 1992 and 1993.
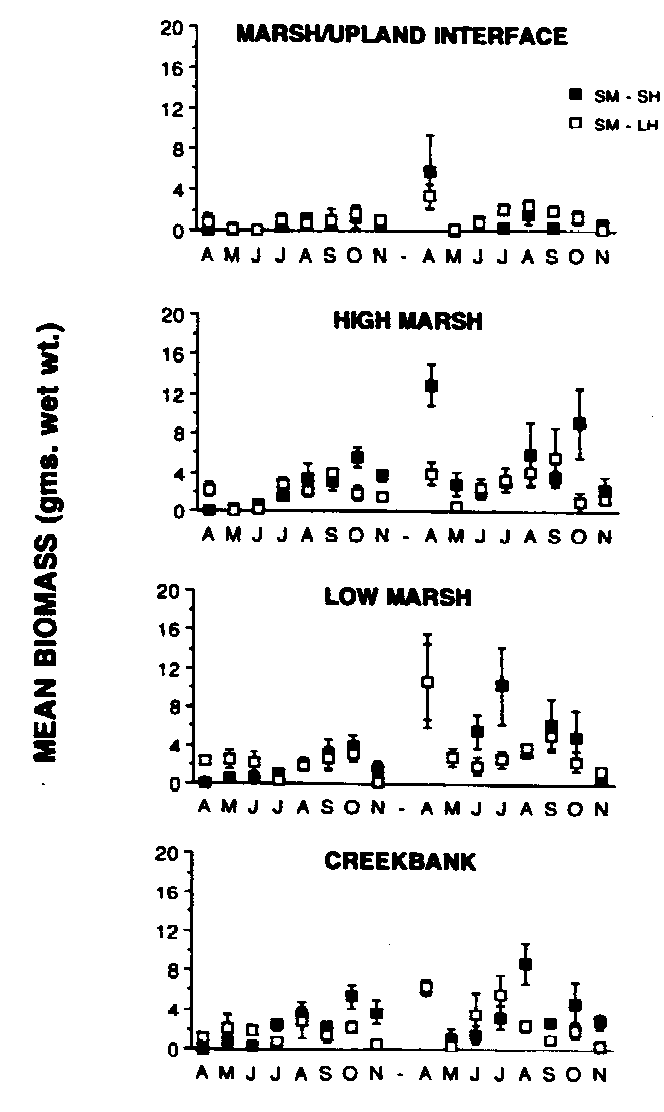 Figure 4.5 Mean biomass (gms. wet wt.) of fishes on the surface of Phillips
Creek Marsh (salt marsh; short hydroperiod) and Hammocks Marsh (salt marsh;
long hydroperiod); April - November, 1992 and 1993.
Figure 4.5 Mean biomass (gms. wet wt.) of fishes on the surface of Phillips
Creek Marsh (salt marsh; short hydroperiod) and Hammocks Marsh (salt marsh;
long hydroperiod); April - November, 1992 and 1993.
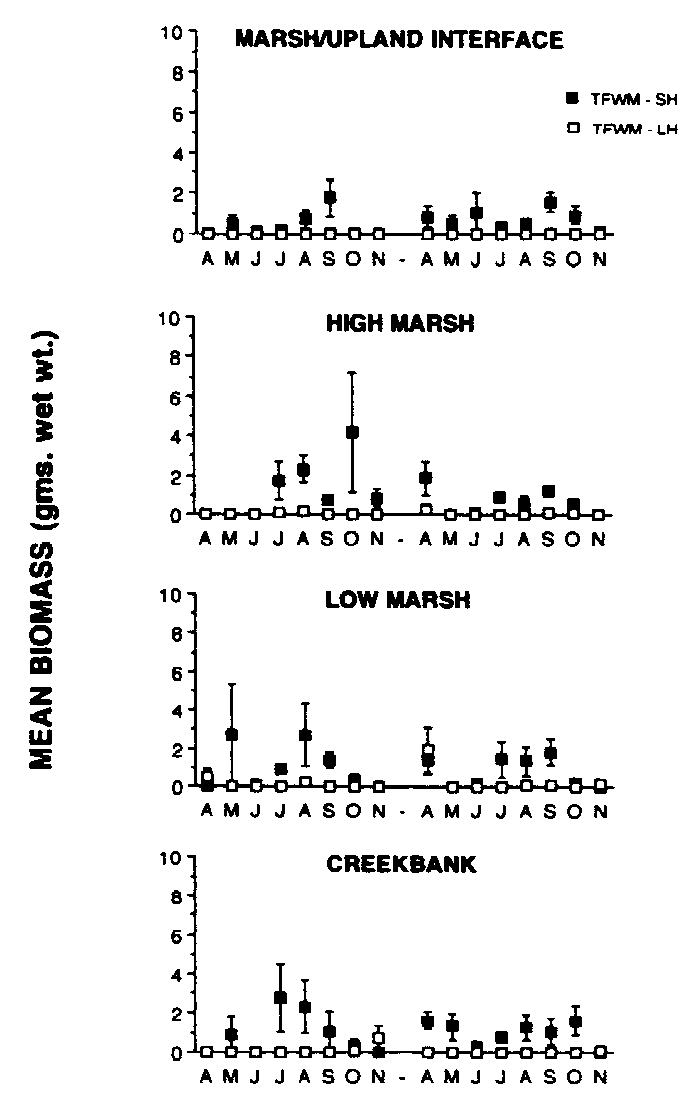 Figure 4.6 Mean biomass (gms. wet wt.) of fishes on the surface of Beaver Dam
Creek Marsh (tidal freshwater marsh; short hydroperiod) and Eagle Bottom Marsh
(tidal freshwater marsh; long hydroperiod); April - November, 1992 and 1993.
Figure 4.6 Mean biomass (gms. wet wt.) of fishes on the surface of Beaver Dam
Creek Marsh (tidal freshwater marsh; short hydroperiod) and Eagle Bottom Marsh
(tidal freshwater marsh; long hydroperiod); April - November, 1992 and 1993.
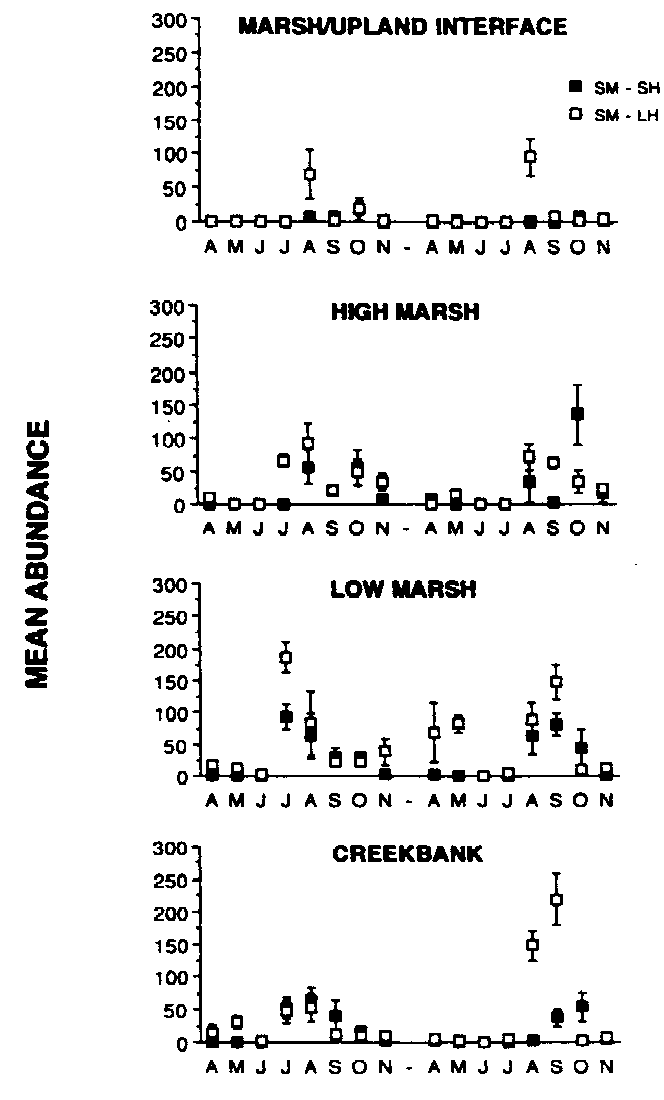 Figure 4.7 Mean abundance of grass shrimp on the surface of Phillips Creek Marsh
(salt marsh; short hydroperiod) and Hammocks Marsh (salt marsh; long
hydroperiod); April - November, 1992 and 1993.
Figure 4.7 Mean abundance of grass shrimp on the surface of Phillips Creek Marsh
(salt marsh; short hydroperiod) and Hammocks Marsh (salt marsh; long
hydroperiod); April - November, 1992 and 1993.
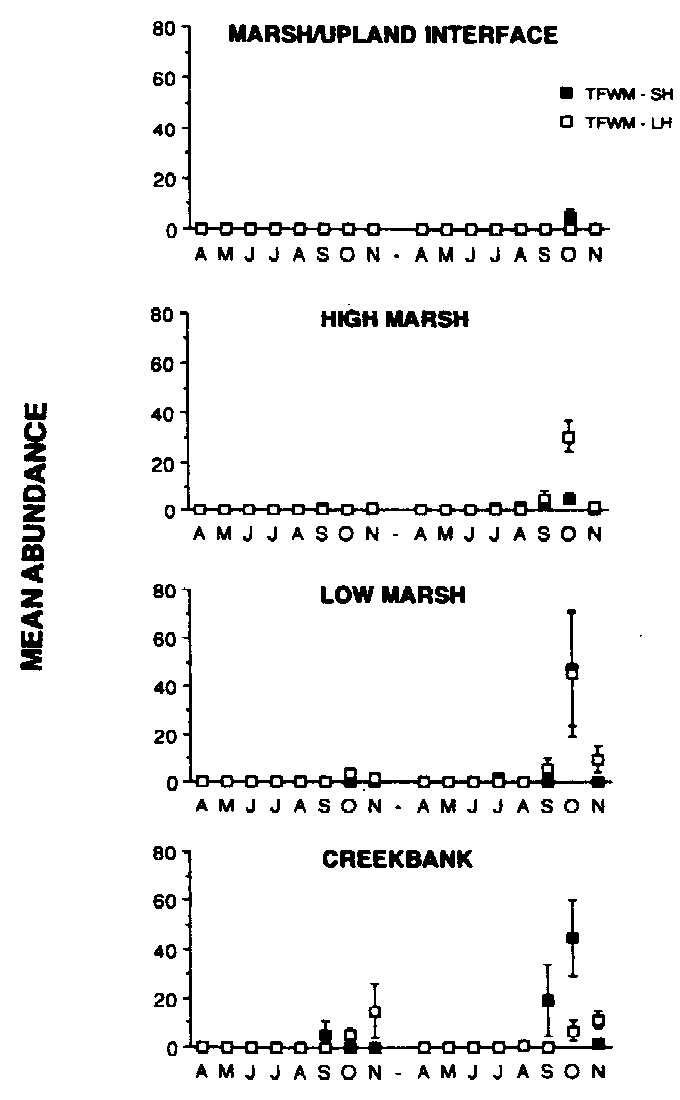 Figure 4.8 Mean abundance of grass shrimp on the surface of Beaver Dam Creek
Marsh (tidal freshwater marsh; short hydroperiod) and Eagle Bottom Marsh
(tidal freshwater marsh; long hydroperiod); April - November, 1992 and 1993.
Figure 4.8 Mean abundance of grass shrimp on the surface of Beaver Dam Creek
Marsh (tidal freshwater marsh; short hydroperiod) and Eagle Bottom Marsh
(tidal freshwater marsh; long hydroperiod); April - November, 1992 and 1993.
 Figure 4.9 Mean biomass (gms. wet wt.) of grass shrimp on the surface of
Phillips Creek Marsh (salt marsh; short hydroperiod) and Hammocks Marsh (salt
marsh; long hydroperiod); April - November, 1992 and 1993.
Figure 4.9 Mean biomass (gms. wet wt.) of grass shrimp on the surface of
Phillips Creek Marsh (salt marsh; short hydroperiod) and Hammocks Marsh (salt
marsh; long hydroperiod); April - November, 1992 and 1993.
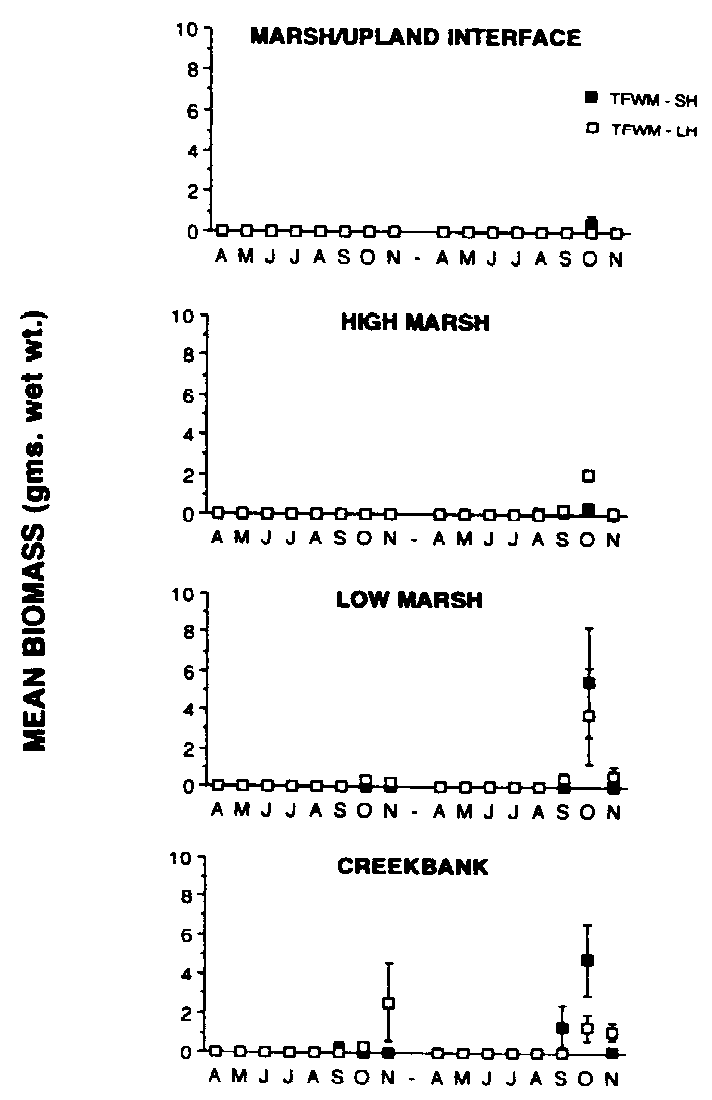 Figure 4.10 Mean biomass (gms. wet wt.) of grass shrimp on the surface of Beaver
Dam Creek Marsh (tidal freshwater marsh; short hydropriod) and Eagle
Bottom Marsh (tidal freshwater marsh; long hydroperiod); April - November,
1992 and 1993.
Figure 4.10 Mean biomass (gms. wet wt.) of grass shrimp on the surface of Beaver
Dam Creek Marsh (tidal freshwater marsh; short hydropriod) and Eagle
Bottom Marsh (tidal freshwater marsh; long hydroperiod); April - November,
1992 and 1993.
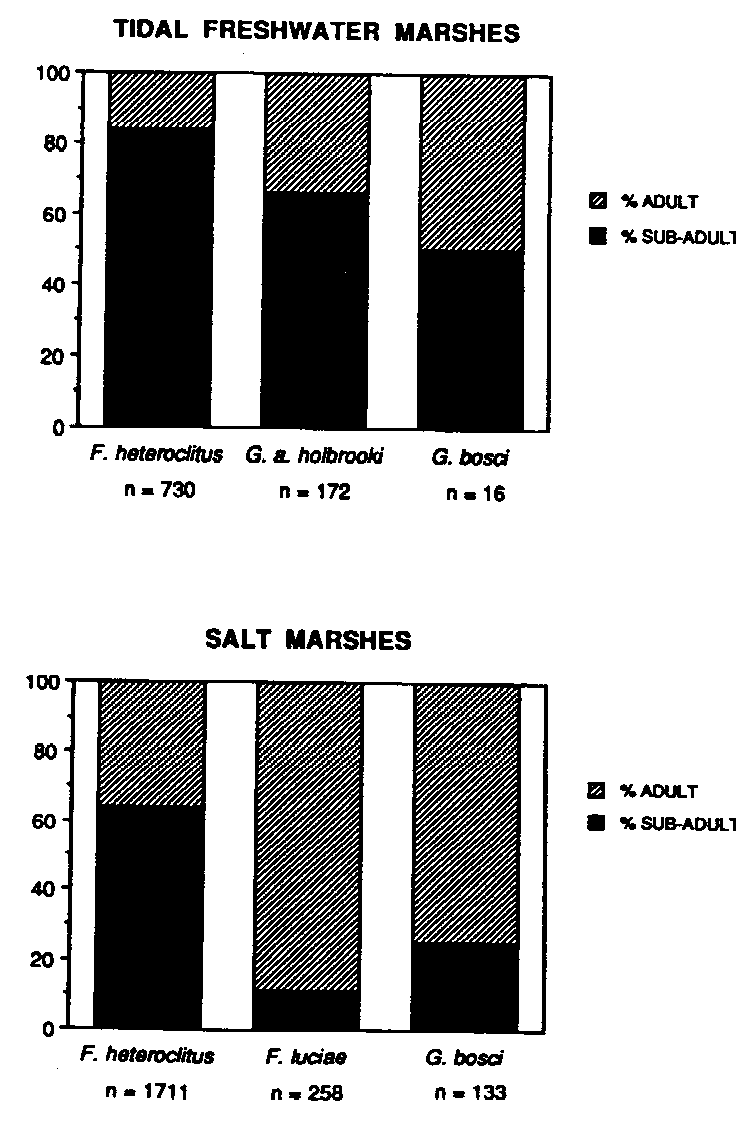 Figure 4.11 Percent contribution of adult and sub-adult fishes from tidal
freshwater marshes and salt marshes.
Figure 4.11 Percent contribution of adult and sub-adult fishes from tidal
freshwater marshes and salt marshes.
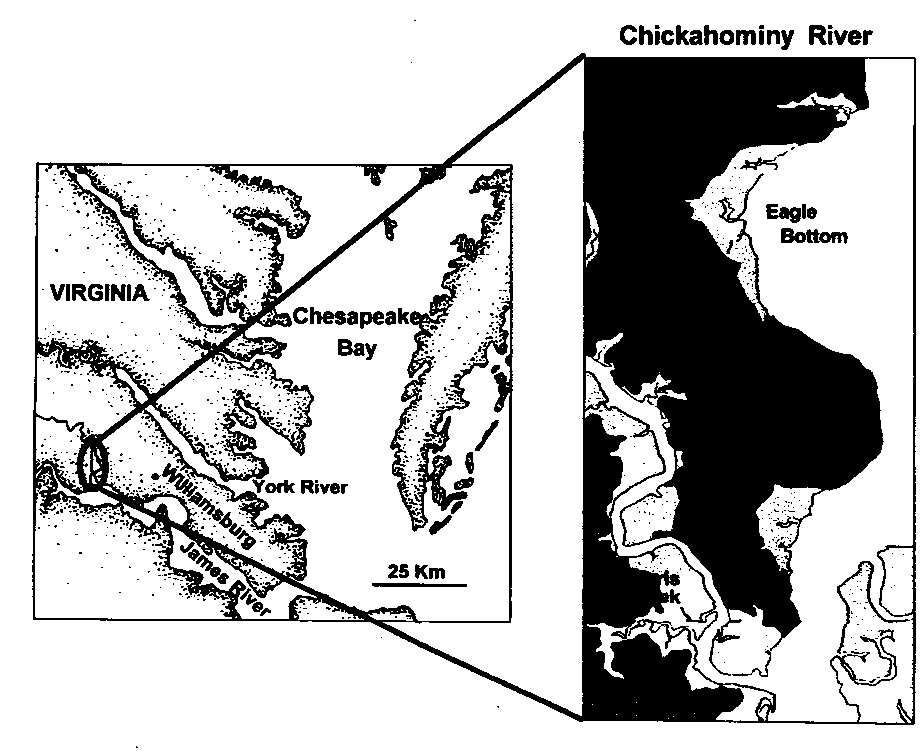 Figure 6.1 Map of lower Chesapeake Bay and Eagle Bottom marsh.
 Figure 6.2 Densities (No. 10 cm-2) of major meiofaunal taxa from
pool and hummock microhabitats, November 1991.
Figure 6.2 Densities (No. 10 cm-2) of major meiofaunal taxa from
pool and hummock microhabitats, November 1991.
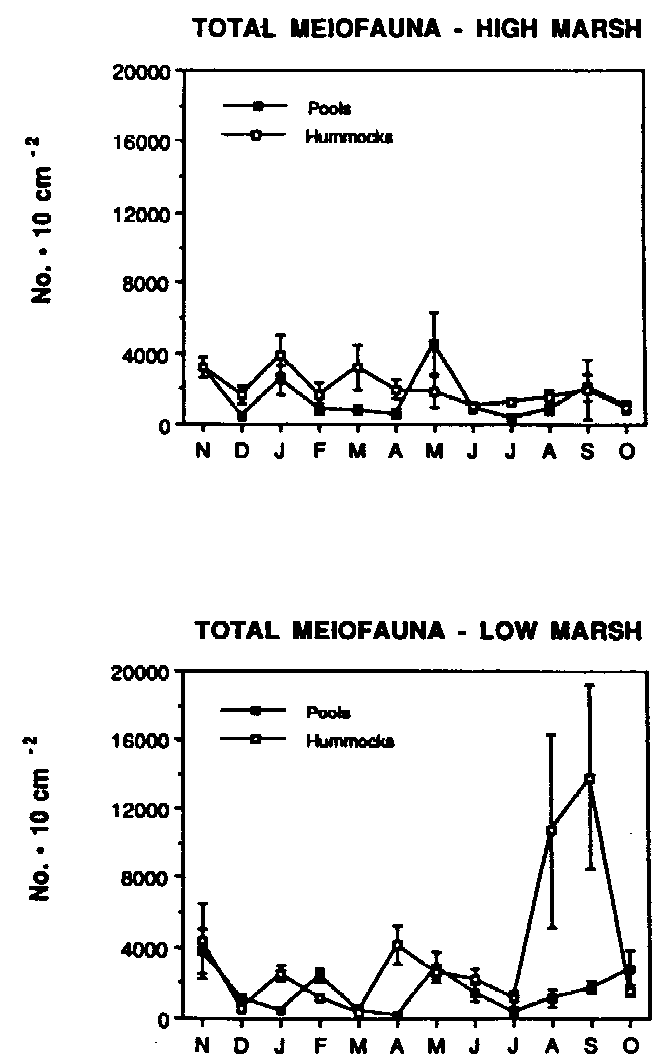 Figure 6.3 Density (No. 10 cm-2) of total meiofauna from pool and
hummock microhabitats, high and low marsh zones, November 1992 - November
1993.
Figure 6.3 Density (No. 10 cm-2) of total meiofauna from pool and
hummock microhabitats, high and low marsh zones, November 1992 - November
1993.
 Figure 6.4 Density (No. 10 cm-2) of nematodes from pool and hummock
microhabitats, high and low marsh zones, November 1992 - November 1993.
Figure 6.4 Density (No. 10 cm-2) of nematodes from pool and hummock
microhabitats, high and low marsh zones, November 1992 - November 1993.
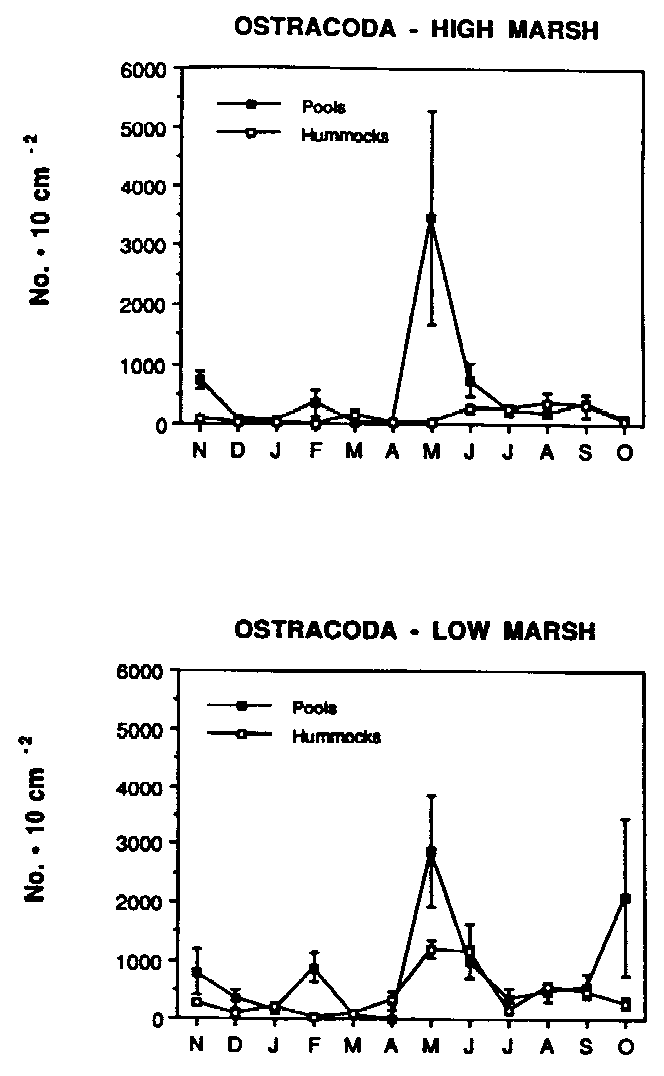 Figure 6.5 Density (No. 10 cm-2) of ostracods from pool and hummock
microhabitats, high and low marsh zones, November 1992 - November 1993.
Figure 6.5 Density (No. 10 cm-2) of ostracods from pool and hummock
microhabitats, high and low marsh zones, November 1992 - November 1993.
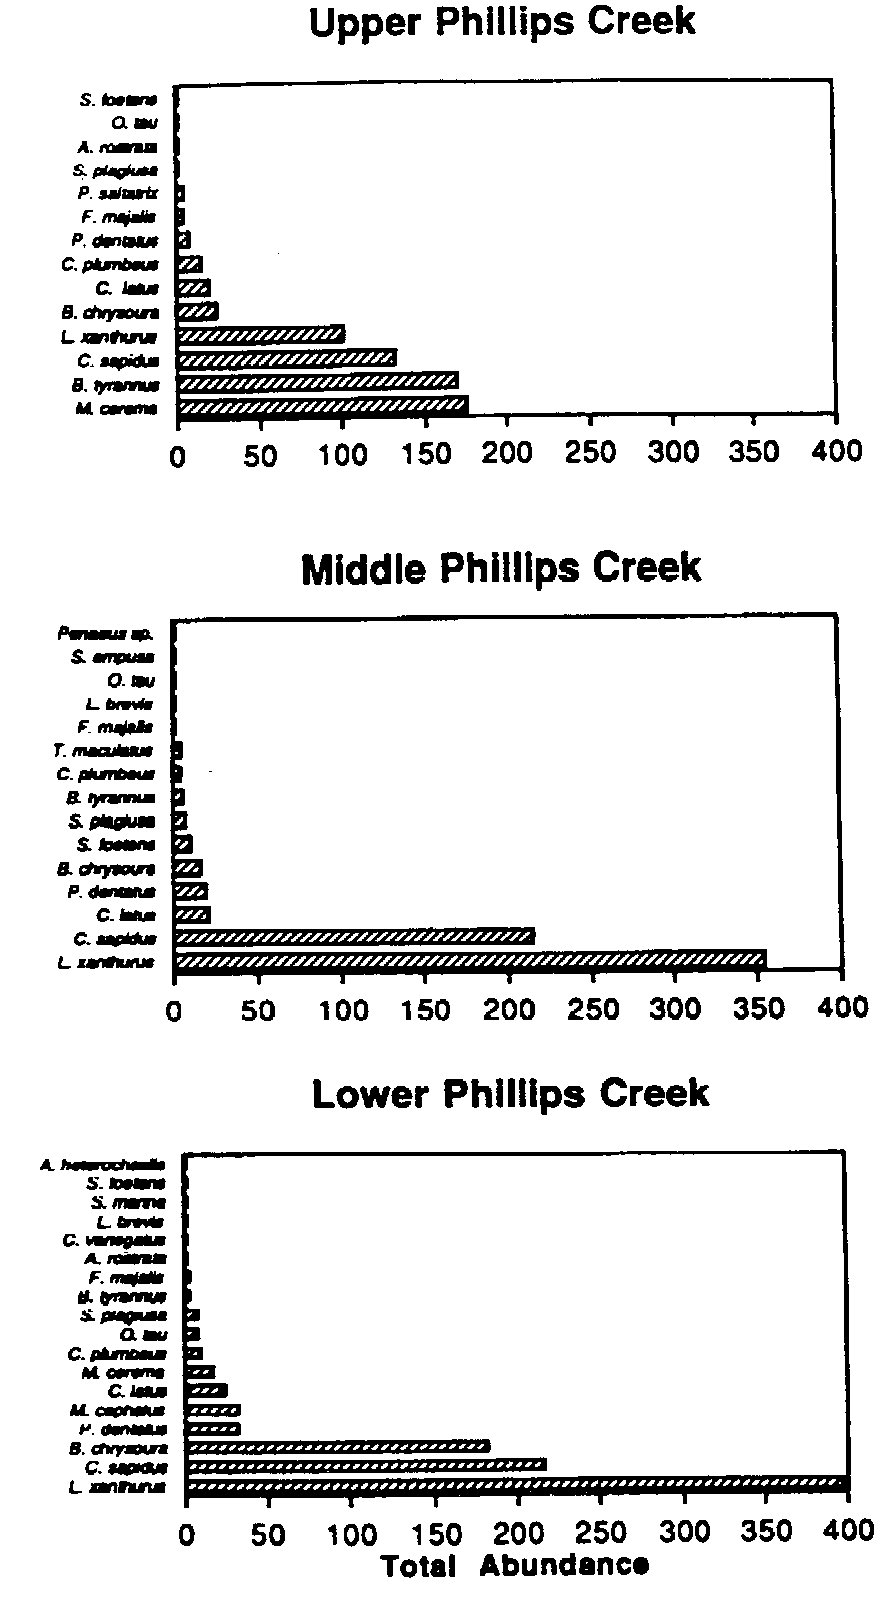 Total nekton abundance, upper, middle, and lower Phillips Creek
stations, summer 1993.
Total nekton abundance, upper, middle, and lower Phillips Creek
stations, summer 1993.
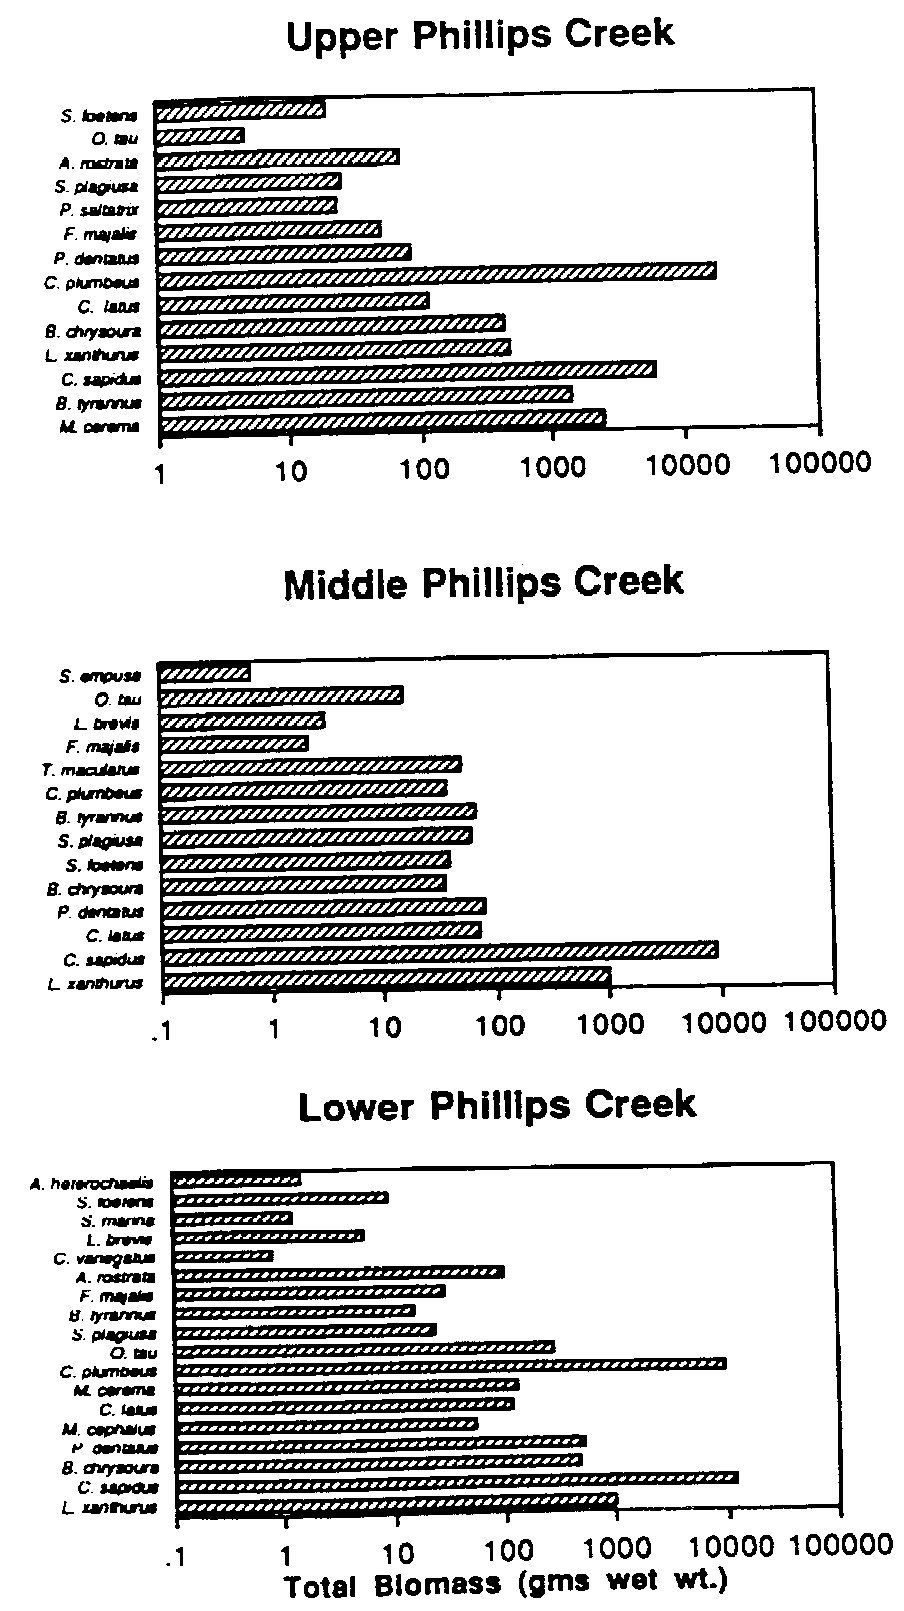 Total nekton biomass (gms wet wt.), upper, middle, and lower Phillips Creek
stations, summer 1993.
Total nekton biomass (gms wet wt.), upper, middle, and lower Phillips Creek
stations, summer 1993.
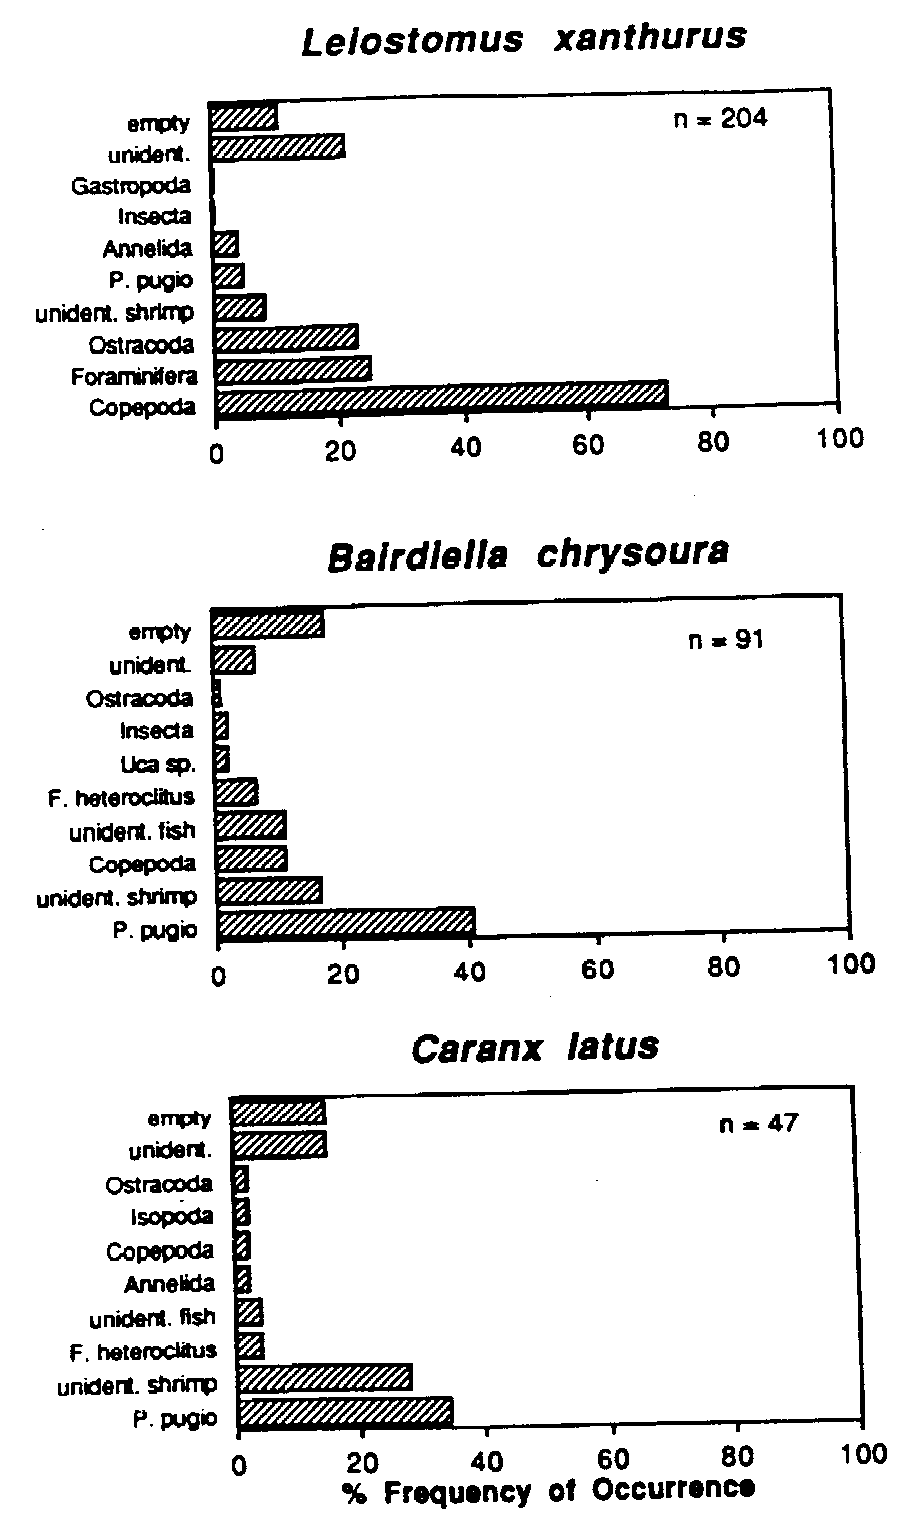 Gut contents of spot Leiostomus xanthurus, silver perch Bairdeilla
chrysoura, and horse-eye jack Caranx latus collected from Phillips
Creek, summer 1993.
Gut contents of spot Leiostomus xanthurus, silver perch Bairdeilla
chrysoura, and horse-eye jack Caranx latus collected from Phillips
Creek, summer 1993.
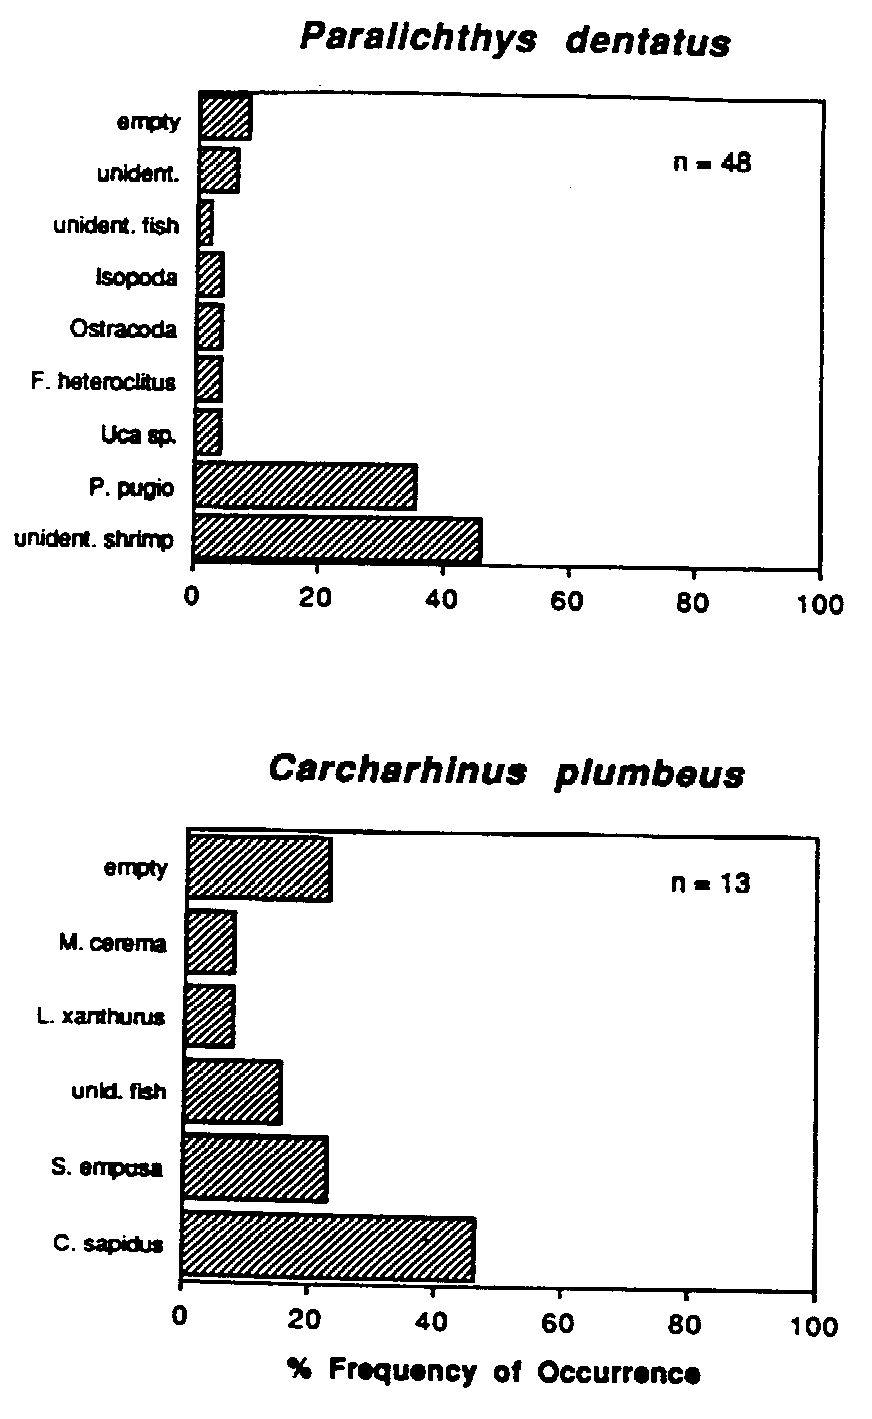 Gut contents of summer flounder Paralichthys dentatus and juvenile
sandbar sharks Carcharinus plumbeus collected from Phillips Creek,
summer 1993.
Gut contents of summer flounder Paralichthys dentatus and juvenile
sandbar sharks Carcharinus plumbeus collected from Phillips Creek,
summer 1993.
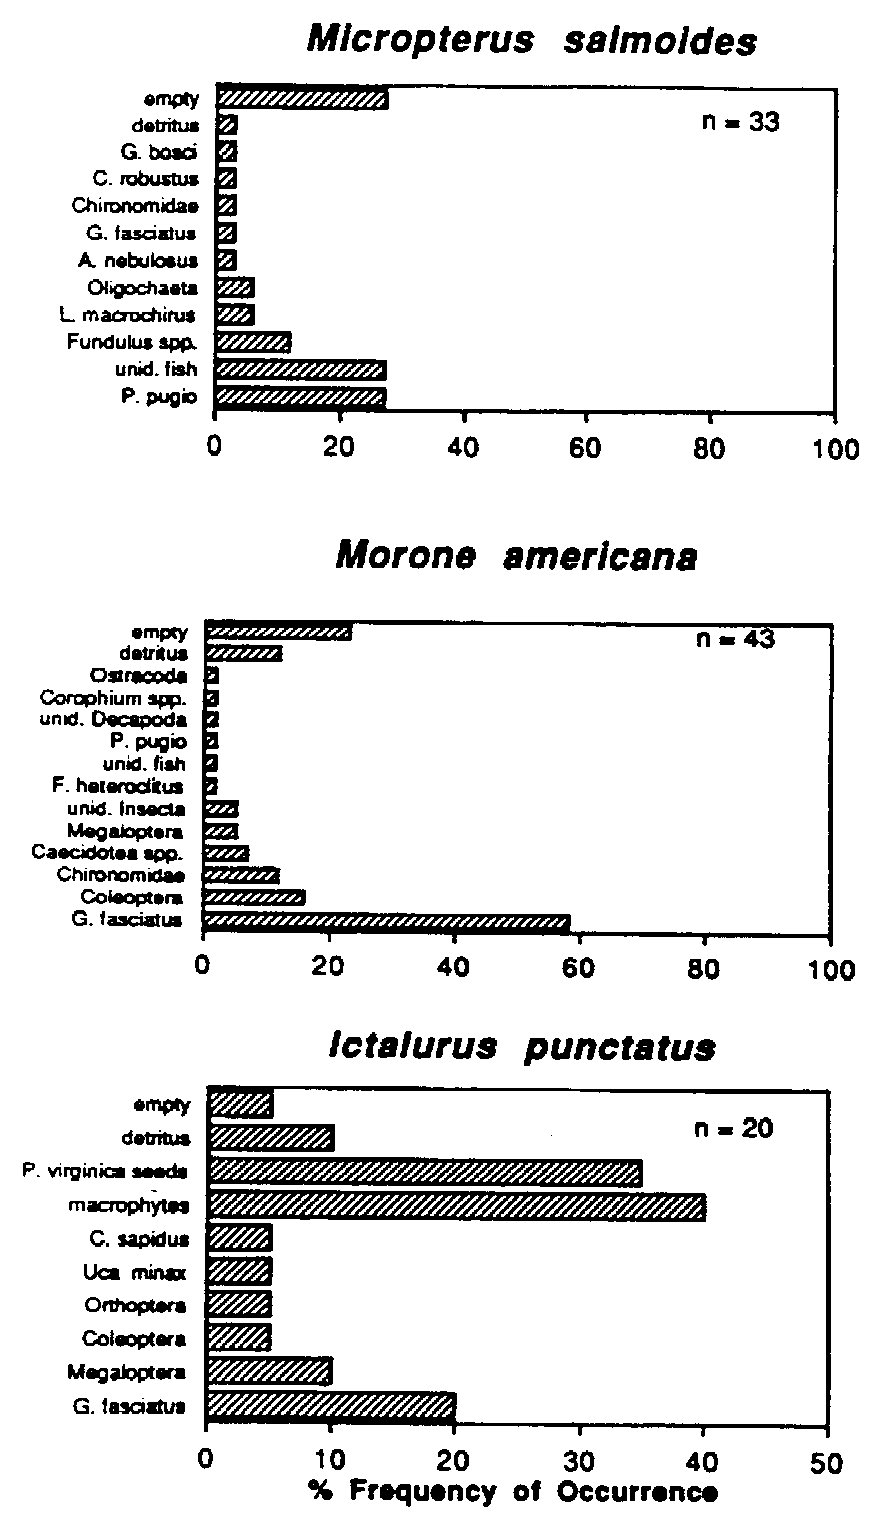 Food habits of largemouth bass Micropterus salmoides, white perch
Morone americana, and channel catfish Ictalurus punctatus
collected from Beaver Dam Creek, 1992 - 1993.
Food habits of largemouth bass Micropterus salmoides, white perch
Morone americana, and channel catfish Ictalurus punctatus
collected from Beaver Dam Creek, 1992 - 1993.