
Figure 1. Distribution of permanent plots on north Parramore Island
showing range of vegetation zones covered. Plots have been overlain onto
a 2 m. resolution false color image. (note: plot radii not to scale.)
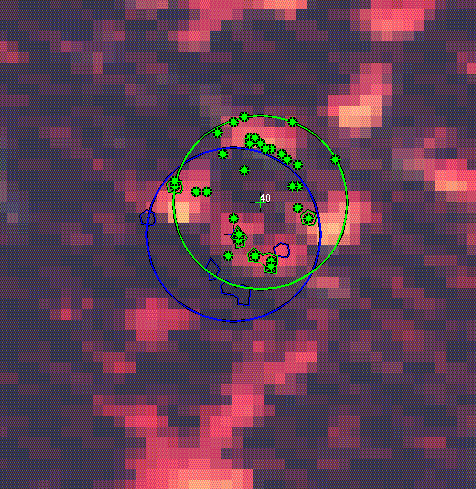
Figure 2. Example of post-survey plot location adjustment. Blue
lines represent preselected plot location and boundary, green are same
after adjustment. Astericks represent surveyed stem locations, with larger
stems surrounded by a circle. The location was shifted approximately 8 m.
northeast for a better fit between canopy clusters (bright areas of image)
and gaps (shadow areas) with surveyed locations. That such a shift was
needed had been noted in the field.
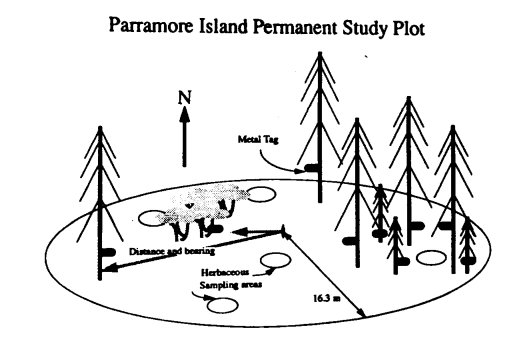
Figure 3. Schematic diagram of plot design.

Figure 5. Example of principlal component mapping. Red cedar,
loblolly pine, Celtis, and Baccharis were positively
correlated with component 3; red bay was negatively correlated. Plots with
strongest correlation scores shown in red.