
|
| VIRGINIA COAST RESERVE LONG-TERM ECOLOGICAL RESEARCH |
Site OYSM, Month SEP, Year 1997 |

| 
|
| Day of Month | Precip (mm) | Max Temp. oC | Min Temp. oC | Mean Temp. oC | Wind Speed (m/s) | Wind Dir (deg.) | Vapor Press. (mb) | Solar Rad. KJ/m2 | PAR uE/m2 |
|---|---|---|---|---|---|---|---|---|---|
| 1 | 0.00 | 29 | 23 | 25.3 | 0.81 | 195 | 27.42 | . | . |
| 2 | 0.00 | 30 | 21 | 25.8 | 1.16 | 200 | 27.17 | . | . |
| 3 | 0.25 | 28 | 17 | 23.6 | 2.93 | 313 | 22.51 | . | . |
| 4 | 0.00 | 21 | 13 | 17.0 | 2.94 | 9 | 10.28 | . | . |
| 5 | 0.00 | 25 | 11 | 18.3 | 1.25 | 306 | 12.24 | . | . |
| 6 | 0.00 | 28 | 14 | 21.8 | 1.86 | 225 | 15.93 | . | . |
| 7 | 0.00 | 30 | 21 | 24.2 | 1.81 | 247 | 18.58 | . | . |
| 8 | 0.00 | 29 | 21 | 23.8 | 2.15 | 93 | 24.24 | . | . |
| 9 | 0.00 | 25 | 22 | 23.0 | 3.33 | 71 | 25.26 | . | . |
| 10 | 0.00 | 28 | 22 | 24.6 | 1.17 | 196 | 26.43 | . | . |
| 11 | 0.76 | 25 | 21 | 23.3 | 1.79 | 200 | 25.46 | . | . |
| 12 | 0.00 | 28 | 19 | 23.3 | 0.98 | 229 | 25.29 | . | . |
| 13 | 0.00 | 27 | 16 | 22.2 | 1.33 | 332 | 20.02 | . | . |
| 14 | 0.00 | 27 | 15 | 20.8 | 1.21 | 314 | 17.57 | . | . |
| 15 | 0.00 | 27 | 16 | 21.1 | 0.62 | 218 | 19.23 | . | . |
| 16 | 0.00 | 28 | 17 | 22.4 | 0.82 | 32 | 20.72 | . | . |
| 17 | 0.00 | 29 | 16 | 22.5 | 1.06 | 230 | 20.93 | . | . |
| 18 | 0.00 | 27 | 18 | 22.9 | 1.05 | 265 | 23.97 | . | . |
| 19 | 0.00 | 28 | 20 | 23.9 | 0.93 | 133 | 26.38 | . | . |
| 20 | 0.00 | 32 | 20 | 26.5 | 3.05 | 236 | 25.65 | . | . |
| 21 | 0.00 | 20 | 13 | 17.5 | 2.94 | 16 | 11.69 | . | . |
| 22 | 0.00 | 22 | 11 | 16.6 | 1.12 | 59 | 12.93 | . | . |
| 23 | 0.00 | 27 | 14 | 20.8 | 1.65 | 270 | 18.45 | . | . |
| 24 | 0.25 | 20 | 14 | 16.8 | 2.29 | 43 | 13.70 | . | . |
| 25 | 4.32 | 19 | 14 | 16.3 | 1.19 | 16 | 17.52 | . | . |
| 26 | 0.00 | 20 | 15 | 17.1 | 1.57 | 280 | 18.32 | . | . |
| Mon. Tot. Precip. 5.6 mm | Mean wind vel. 1.654 m/s |
| Mon. Mean Temp. 21.6 deg. C | Wind dir 295 deg |
| Mean Max. Temp. 26.1 deg. C | Mean Min. Temp. 17.1 deg. C |
| Extreme Max. Temp 32.2 deg. C | Mean vapor press 20.30 mb |
| Extreme Min. Temp 10.7 deg. C | Total Solar Rad . KJ/sq. m |
| Total photosyn. . uEin/sq.m |
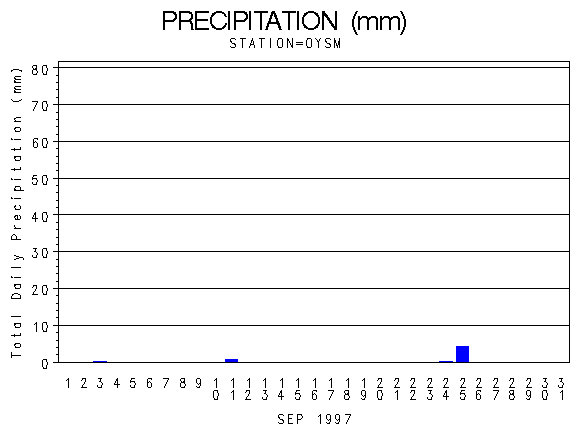 |
| Daily Total Precipitation (mm) |

 |
| Hourly Mean Temperatures (deg. C) |
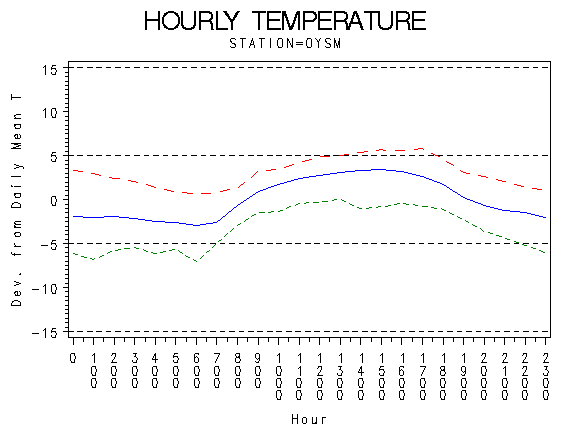 |
| Hourly Max Min and Mean Temperatures (deg. C) |
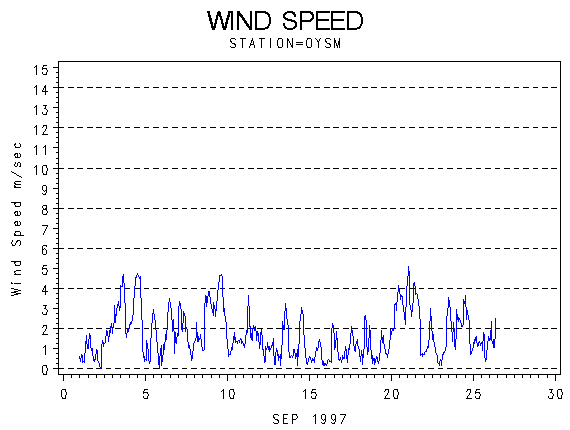 |
| Wind Speed (m/s) |
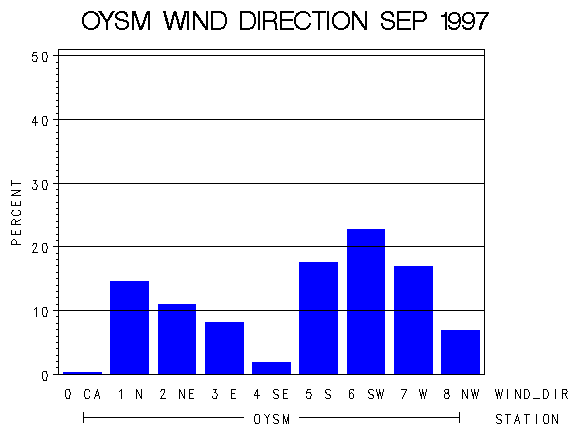 |
| Frequency of Wind Direction |
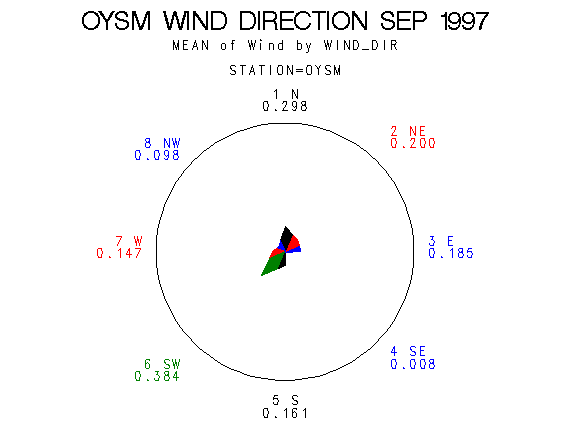 |
| Wind Vectors (circle=1.5 m/s) |
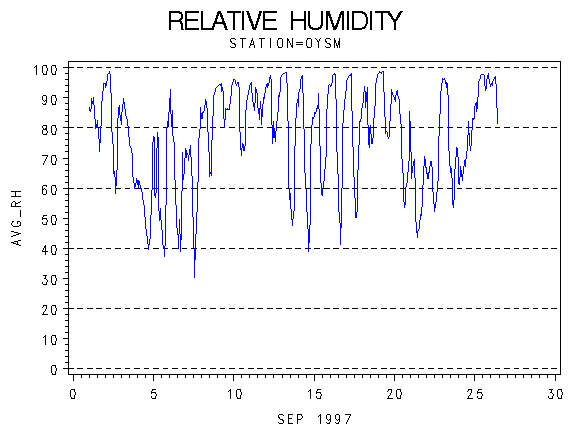 |
| Relative Humidity (percent) |
 |
| Photosynthetically Active Radiation (micro-einsteins per m squared) |
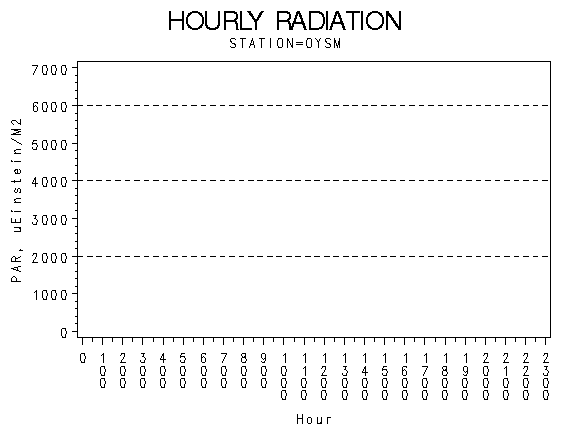 |
| Hourly Photosynthetically Active Radiation (micro-einsteins per m squared) |
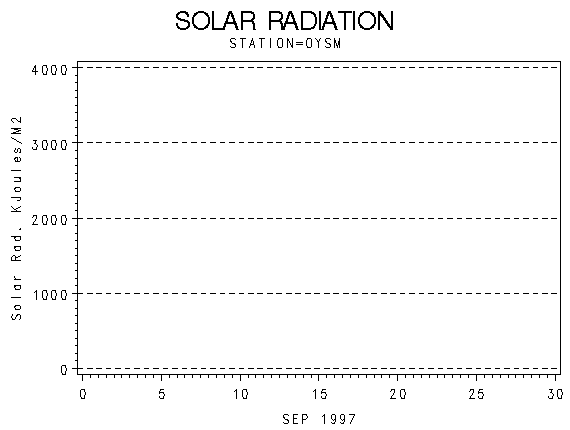 |
| Solar Radiation (KiloJoules per Meter Squared) |
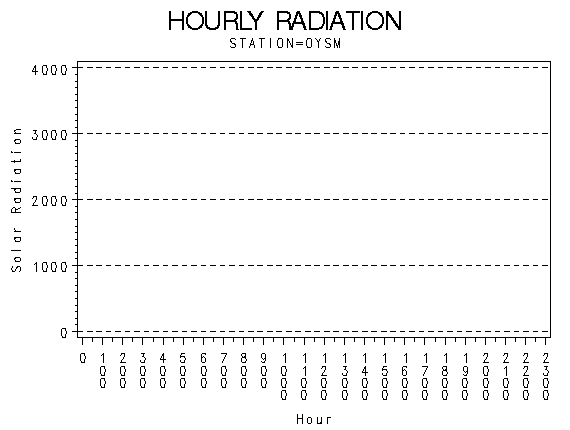 |
| Hourly Solar Radiation (KiloJoules per Meter Squared) |
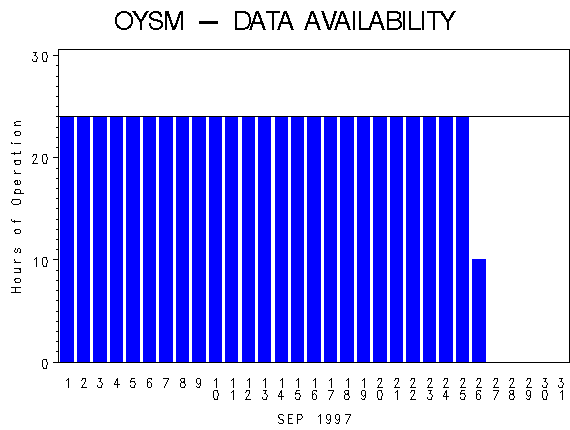 |
| Hours of Station Operation |
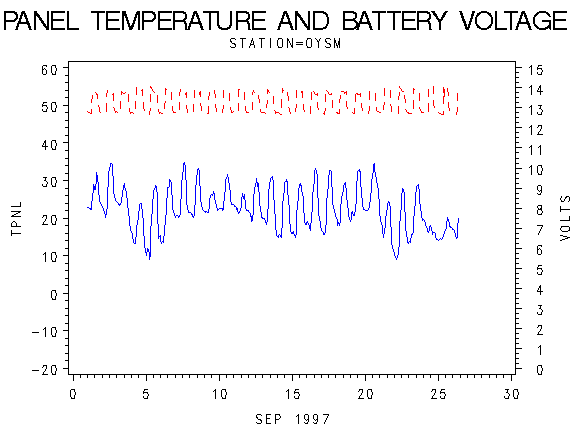 |
| Data Logger Battery Voltage and Internal Logger Temperature |