I would like to thank the National Science Foundation for my funding through the Research Experience for Undergraduates program. As an REU, I began this project as a summer job and it soon culminated into a Distinguished Undergraduate Thesis. I would like to thank the Department of Enviornmental Science faculty, staff and graduate students for all of their guidance and encouragement. The summer of 1994 was much more enjoyable because of the REUs and graduate students who helped me in the field and laboratory. Charles R. Carlson and James Spitler were willing and flexible site managers at the Virginia Coast Reserve. Dr. Stephen A. Macko and Dr. Linda Blum were patient and invaluable resources throughout this past year. I appreciate the computer talents of Ken Potter and Ann Salerno who helped me design some of the figures. In addition, I want to thank my family, friends and roommates for their continued support and understanding during my research exploits.
Stable isotopic studies of the organic matter in sediments can detail the history of a Spartina alterniflora marsh. The purpose of this study is to determine a history of the marsh and to examine the processes of early diagenesis. Bulk isotopic analysis suggests that the different sediment layers from cores taken in the Spartina alterniflora marsh may have originated from similar sources. The 13C values range from -16 to -18‰ and most 15N values range from 6 to 8‰. Carbon and nitrogen trends indicate early diagenesis effects in the upper 10 cm of the cores. A previous study site in the marsh west of Hog Island revealed a 60 cm mud layer found between old and new S. alterniflora marsh layers. This darker mud layer, devoid of S. alterniflora, was believed to be composed of lagoonal bottom sediments deposited on the adjacent marsh during the 1933 Chesapeake and Potomac hurricane. Studies of four 100-130 cm cores taken in the Cattleshed Creek marsh indicate that this deposition occurred on a small scale as only one of the four cores demonstrated the anomalous layer. This present investigation also suggests that the hurricane may be responsible for relocating in situ marsh sediments, but not lagoonal or creek sediments as previously believed. The presence of an anomalous mud layer in one core in four is curious because hurricane deposition could be expected to be evident in all cores of close proximity. Therefore the probability that the hurricane is responsible for the deposition of 60 cm of mud in one spot is questioned. This study suggests that the mud layer results from one of two possible mechanisms. Redistribution of in situ marsh sediment, not lagoonal bottom sediment, or a mixing of S. alterniflora and creek bottom sediments may be responsible for the carbon and nitrogen signals of the mud layer.
Introduction:
The Long Term Ecological Research (LTER) site on the Eastern Shore, also known
as the Virginia Coast Reserve, includes barrier islands and the surrounding
marshes. Hog Island is one of the barrier islands that forms a chain running
east of the Delmarva peninsula
(Map 1)
. The marsh spans several square
kilometers and lies at approximately 37o26' latitude and 75o 42' longitude. The
creek adjacent to the site meanders for 0.5 km through the marsh from the
western side nearest the lagoon to the eastern side of the marsh nearest Hog
Island. The shallowest part of Cattleshed Creek, also known as Cattlepen
Creek, has an average depth of 1 m, but in the mid-stream can be several meters
deep. This tidal creek acts as a nutrient source for the abundant Spartina
alterniflora growth which thrives under tidal range of approximately 0.35
m. During low tide, the creek becomes extremely shallow, but at high tide the
water rises to flood the bottom of the S. alterniflora marsh.
The marshes along the Eastern Shore have flourished as part of a constantly changing ecosystem. The marshes west of Hog Island are geologically young and formed within the last thousand years. The barrier island system developed and moves in a general westward trend every year. Large storm events cause the barrier islands to accrete and erode in different directions depending on the strength and impact of the storm. Marshes develop on the more stable, western side of the islands until the roll-over process obliterates the marshes. The geographic history of Hog and many other barrier islands is filled with storm occurrences that have shifted the orientation of island growth and recession over time. The Halloween storm of 1991 caused great changes in the coastlines of both Parramore and Hog Islands. Within the 20th century, Hog Island has reversed the pattern of accretion from the southern end to the northern tip.
Storms along the Eastern Shore can be violent and detrimental because of their resultant scarring and restructuring of barrier island environments. One particular storm during the early part of this century is believed to have disrupted the marshes off the western side of Hog Island. Previous 14C dating of the mud layer revealed that the sediment was deposited around 1933. In this year, the Chesapeake and Potomac hurricane was the only hurricane to make a direct assault on the Mid-Atlantic region. It followed an unusual storm path as it moved in a northwest direction. The hurricane was tracked from August 17-26, 1933 and is remembered as one of the worst storms in Mid-Atlantic history because of the resulting devastation and deaths. The storm originated east of the Windward Islands, travelled westward, then northwest by north until it reached southwest of Bermuda. The storm hit a 200 mile range with high winds and a storm surge that had built up over Bermuda, but is categorized as moderate strength. The focal point of the hurricane's assault was on the Delmarva Peninsula and New Jersey (Cobb,1991).
Previous studies of the marshes along Cattleshed Creek suggested that a 1933 hurricane covered the surrounding marsh with sediments stirred up from the nearby lagoon. The Chesapeake and Potomac hurricane is thought to be the intense storm that swept adjacent lagoonal bottom mud onto the marsh surface. This sediment could have buried the 1933 S. alterniflora marsh with 55 cm of grey mud. New marsh recovered and developed another S. alterniflora layer at the surface that has withstood many post-1933 storms.
In the present study, 14C dating was used to attribute the mud layer to a late summer 1933 hurricane (Zieman unpublished, 1992). The 14C technique was used for dating the S. alterniflora immediately below the mud layer. Stable isotope signals like 13C and 15N are used as indicators of diagenesis and the origin of organic matter found in the sediments. Stable isotopes in this study will document the origin of mud layer sediment and signs of early diagenesis. In a related study, Pb-210 was used to relate the depositional history of a salt marsh core. Increased Pb-210 activity occurs where severe hurricanes caused deposition. Pb-210 scatter during severe storms is seen as sediment mixing below the depth of bioturbation. In this study, the disturbance marked at 25-26 cm did not match with the known depth for hurricane deposition and can be attributed by an unrecorded winter storm (Farrington et al., 1977).
The 15N and 13C of seagrasses have shown little change over time and during decomposition. Instead the signals reflect the stable isotope ratios of the original material (Zieman, et al., 1984). In comparison, the 15N isotopes in marine and estuarine systems range from -3‰ for plankton to 18‰ for higher organisms (Sigleo et al., 1985). In this study, the major marsh vegetation is S. alterniflora. For these C4 plants, the typical range of values is -15 to -12‰ for 13C and 1 to 8‰ for 15N (Ostrom et al., 1993). S. alterniflora from a Georgia salt marsh had 13C compositions of -13.6 to -12.3‰, within the range of other C4 plants (Haines, 1976). The S. alterniflora from Hog Island produced a 13C signal of -14‰ and a 15N of 4‰.
In addition to the isotopic compositions of plants, sediments also offer clues about the effects of early diagenesis on the geochemical properties of the source. Early diagenesis is more complex than breakdown and loss of sedimentary organic material. Chemical and isotopic analysis of an organic material reveals information about its source and diagenetic history. Often studies of natural environments cannot pinpoint a specific source of an isolated organic material because lack of direct evidence is limited by little knowledge of the specific source or diagenetic pathway. However, stable isotope studies using 13C and 15N can indicate the source material involved in diagenesis (Macko et al., 1994).
Kleberg Point
The distinct roles of diagenesis and mixed deposition in the Hog Island cores
are difficult to assess. A previous study that contributed to the
understanding of processes on the Eastern Shore occurred in Texas. Studies on
the Kleberg Point algal mat near the Laguna Madre in South Texas displayed mud
layers that were deposited over algal mats during hurricane flooding.
Suspended mud from nearby Baffin Bay is thought to have flooded the area,
buried the algal mats and deposited mud layers. These mud layers demonstrated
13C signals similar to Baffin Bay muds, whereas the algal mats were 4‰
heavier. The carbon signal of the mud layers became slightly enriched in 13C
with depth increasing from -17.9 to 15.5‰. The mud between algal
laminations was enriched in both 15N and 13C. The 15N ranged from 6.5 to
5.2‰ and showed a slight depletion with depth. Typical Baffin Bay muds
are slightly enriched in 13C and depleted in 15N compared to the mud layers.
Two possibilities for why the hurricane deposits are enriched have been
suggested. The source of the organic matter in the Bay muds themselves could
be enriched or diagenetic processes could cause isotopic change (Macko, 1981).
Mixing of sediments with Baffin Bay before deposition or isotopic change in the residual organic matter after deposition are two explanations for the mud layer enrichments. A 1967 hurricane is thought to have mixed Bay seagrass detritus with muds and deposited the enriched mixture on the algal mats. A second explanation is that the organics underwent isotopic change after deposition. The hurricane flood hypothesis was confirmed after another algal mat formed on top of the hurricane deposits. Similar to the previous deposits, the isotopic signals of the mud layer indicated two contributors, the Bay and a mixing of seagrass and planktonic material (Macko, 1981).
The algal mats were covered by suspended Bay sediments disturbed by the hurricane. They were rich in organic matter (10% C and 1.5% N), but lose the organic content with depth. The molar C:N increases with depth as nitrogen is lost and carbon increases. In the top 30 cm, the 15N value increases with depth, while the %N gradually decreases. Diagenesis proceeds in the algal mat laminations, however the deepest layers have already undergone diagenesis as indicated by low 15N values and slightly enriched 13C values (Macko, 1981).
Diagenesis in other studies
Isotopes can help determine the origin and environmental factors about a
region. The 13C for terrestrial organic matter is -27‰ and for terrestrial
plants the 15N range is from -5 to 18‰ (Fogel et al., 1993). A few
studies have examined the effects of diagenesis on the N signal. Miyaka and
Wada found a 15N increase of 3 to 4‰ owing to decomposition of
phytoplankton and zooplankton (Macko,1981). Sedimentary increases in molar C:N
generally result from nitrogen losses during diagenesis. Small changes in the
C:N downcore show mineralization or preservation of carbon and nitrogen. In
Quarternary sediments from the Gulf of Mexico, C:N accurately reflects the
changes in contribution from terrestrial to marine derived source material
(Jasper et al., 1989). In sediments from Lake Biwa, Japan the difference
between land and marine sources is preserved in the C:N. Diagenesis modifies
the C:N of organic content in the sediment, but does not severly alter the
ratio. After a long period of burial, the C:N becomes increasingly insensitive
to further diagenesis. Diagenetic equilibrium in lake sediments is found
downcore where organic matter undergoes extensive microbial activity and no
isotopic shift occurs. In addition, lake sediments with low carbon
concentrations are unaffected by diagenetic processes (Meyers et al., 1993).
As depth increases (down core), depletion of 15N may be the result of diagenesis from deamination or hydrolysis (Macko et al., 1993). Diagenesis is detected by a decrease in amino acid concentration relative to organic carbon. A core from British Columbia displayed active diagenesis in the sediment column resulting in an increase in dissolved organic matter with depth. At 100-110 cm depth 13C values were depleted, amino acids were in low concentration and the organic carbon content was about one-third that of the surface sample. Amino acids are easily identifiable in surface sediments, but decompose with depth as a result of racemization. The isotopic composition of carbon suggested that the dissolved organic matter came from similar source material down core. The concentration of amino acids decreased by an order of magnitude and follows the trend of depleting 13C with depth (Brown, et al., 1972).
Mixing of Sources
The mixing of sources of organic matter in sediments can be traced by a
linear correlation between 13C to 15N. Peters et al. (1978) suggested that a
linear relationship can indicate the mixing of organic matter from marine and
terrigenous sources. However, changes in the carbon and nitrogen ratios from
the source to the site of deposition as a result of diagenetic processes may
limit the applicability of the linear regression. This change in carbon and
nitrogen isotope ratios may result from resistant organic material in sediment
being isotopically different from the original bulk source. Terrestrial and
marine material mixing is the predominant means influencing carbon and nitrogen
isotope compositions in Northeast Pacific coastal marine sediments. Lakes or
lagoons with algae have nitrogen signals indicative of a non-marine source, but
carbon isotope signals resemble algal carbon. Rivers draining agricultural
areas have heavier nitrogen sedimentary values, whereas carbon closely
resembles the source (Peters et al., 1978). Fractionation processes are
influenced by the degradation of organic matter during sedimentation.
Sedimentation results in decreased labile contents and deposition of altered
organic matter with C:N ratios altered from the marine and terrigenous end
members. Isotope analysis using carbon and nitrogen better characterizes the
nature of organic matter in sediments (Peters et al., 1978).
Examination of different environments offers insight into the role of organic mixing sources on sediments. Tan and Strain (1979) found 13C values of -25.6 to -21.8‰ in sediments from the St. Lawrence estuary and suggested that the compositions resulted from mixing processes. Marine carbon from in situ or saline waters and terrestrial carbon from freshwater river discharge mixed with more marine materials in the lower estuary. Higher 13C values in the lower estuary result from microbial decomposition and removal of 12C in terrestrial organic material. Changes in isotopic composition can result from either recycling of organic matter in the water column or diagenesis (Tan et al., 1979). The importance of resuspended sedimentary carbon as a particulate organic carbon (POC) source in the upper estuary is not fully understood. The sedimentary layer may have a light organic carbon component which is not influenced by resuspension or mixing with POC, but may be attributed to diagenesis (Tan et al., 1983). In the Gulf of Mexico, surface sediment is enriched 3-4 ‰ for 13C in comparison to POC because of microbial activity at the water-sediment interface (Schultz et al., 1976). At the sediment-water interface, organic matter is removed, lowering the organic carbon content in bottom sediments. The removal of nitrogen or breakdown of organic material rich in nitrogen, such as algae, increases the C:N of bottom sediments (Cifuentes, 1991). Sediment resuspension in the Great Lakes suggests that selective settling of organic material can occur. Resuspended material is enriched with organic matter in comparison to nonsuspended coarse grains (Meyers et al., 1984).
Alteration and destruction of organic matter within the water column affects the sedimentary organic content (Meyers et al., 1984). Early diagenesis is studied at the water-sediment interface using sediment traps, bottom sediment samples and water particulate matter. The Kawamura (1987) study shows that 97% of the carbon and 94% of the nitrogen in sediment traps results from deposition of sediment resuspended with the remaining portions of carbon and nitrogen from water particles. Fluctuating mixing percentages suggest that either the water column underwent selective degradation during diagenesis or organic material was fractionated when resuspended. The C:N ratio of organic matter in sediment traps shows that 54% of the organic material comes from resuspension and 46% from particulate matter (Kawamura, et al., 1987).
The C:N is essential for understanding the role of diagenesis on organic matter in sediments. In another study, the atomic C:N ratio of land derived organic debris is 12 to 14, whereas the ratio for aquatic organic matter is 7 to 10 (Meyers et al., 1984). Jasper, et al. (1990) saw a variation in the 13C and the C:N in a core from the Gulf of Mexico which suggests mixing of two organic sources.
A study of sediment from Baffin Bay, TX saw a 10-20 year cycle in the 13C values which is consisitent with the frequency of droughts and hurricanes on the Texas coast. The 13C enrichment demonstrates a total organic carbon (TOC) cyclicity with depth and the presence of organic source mixing. Anderson, et al. (1992) found that if the C:N ratio is not altered by diagenesis, the TOC results from a mixing of phytoplankton and seagrass. A TOC value of -15 ‰ reflected the 50:50 combination of -10 ‰ seagrass and -20 ‰ phytoplankton (Anderson et al., 1992).
Changes in the source material could be responsible for anomalies found in sediments and amino acid analysis offers more insight into the processes of diagenesis. Early diagenesis chemistry was examined by Henrichs and Farrington (1987) using TOC and total nitrogen (TN) of sediments, total hydrolyzable amino acids (THAA), and dissolved free amino acids (DFAA). Hydrolyzable amino acids are decomposed more readily than TOC in sediments and amino acids generally decrease with depth. DFAA undergoes daily renewal and removal processes whereas TOC, TN and THAA are viewed in longer time scales. THAA/TN and TN/TOC ratios suggest that proteins and organic carbon are undergoing mineralization at the same rate. The TN/TOC ratio was low and reflects the presence of terrigenous plant detritus in sediments. Organic matter may be metabolized in the water column or at the sediment-water interface. The surface concentration of DFAA is high possibly as a result of microbial activity. At depths below 30 cm, mineralization is too low to affect THAA or TOC trends, while DFAA remain low in concentration and consistent with depth (Henrichs et al., 1987).
Isotopic variation occurs in soils, seagrasses or other organic material when enriched or depleted material is lost. Deamination, condensation, or decarboxylation cause isotopic composition change in organic rich material (Macko et al., 1994). In soil, microbial nitrogen isotope fractionation occurs most significantly in nitrification, followed by denitrification and ammonium assimilation, respectively (Sigleo et al., 1985). In a study of seagrasses, the carbon and nitrogen isotopic ratios of decomposing seagrasses underwent little change (Zieman et al., 1984). As plant decomposition proceeds, seagrass organic material and microbial biomass is gradually mineralized. The 13C and 15N for seagrasses did not change during decomposition. In these plants, much of the nitrogen is found as amino acids (Zieman et al., 1984). In another seagrass study, half of the identifiable amino acids were lost during decomposition. A sediment-seagrass mix monitored during decomposition did not change bulk isotope composition. Carbon and nitrogen losses along with bond formation and breakage altered the isotopic signal (Macko et al., 1994).
Studies of the changes in the concentrations and stable isotope abundances of individual amino acids include bulk organic carbon and nitrogen isotopic abundances, and amino acid content and compositions (Macko et al., 1994). Primary organic nitrogen compounds in the biosphere are amino acids which are found as enzymes, peptides or proteins. Free amino acids are formed by hydrolysis of peptides and proteins from enzymes and bacterial activity (Sigleo et al., 1985). The presence of amino acids implies differences in decomposition reactions, other geochemical reactions or depositional environments. Amino acid content may indicate the source of sedimentary organic matter, however, these labile components also are lost or altered during diagenesis (Macko et al., 1993). Nitrogen enrichment with a simultaneous decrease in amino acid content indicates diagenesis, resulting from peptide bond hydrolysis and bacterial mineralization of free amino acids (Macko et al., 1994). Amino acids are mineralized preferentially in comparison to bulk organic material in marine sediments and sediment traps, possibly because amino acids are more labile than other carbon and nitrogen particulate matter. Amino acid decomposition is an important pathway in the recycling of organic carbon and nitrogen (Burdidge, et al., 1988).
Amino acid analysis is a useful tool for understanding diagenesis, but was not part of this study. The current study was designed to resolve two unknowns about the HC2 mud layer: what is the source of this material and is the 1933 hurricane responsible for its presence. This investigation addresses the roles of early diagenesis in the sediments and the contribution of multiple organic sources to the sediments. Diagenesis changes the isotopic signature and geochemical characterisitics of organic matter upon deposition and decomposition. The role of diagenesis in these sediments is difficult to assess, but this study demonstrates that early diagenetic processes have occurred in the HC2 mud layer and pre-1933 sediments. Multiple element isotopic analysis was used to resolve closely related signatures and showed that the mud layer could result from mixing of two sources: S. alterniflora marsh grass and tidal creek bottom sediments.
Methods and Materials:
The project site for a series of sediment core extractions was a Spartina
alterniflora marsh located 1 km west of Hog Island
(Map 1)
. A site along
Cattleshed Creek was recommended to address the question of the hurricane storm
deposition. This location was the site of an experiment in 1992 which tested
marsh plant behavior when subjected to rising sea level conditions. The core
samples for the current study were taken 5 m from the creek bank.
Four 100- to 130-cm cores were taken, two in August and two in October, 1994. All of the cores were taken at similar elevation because the marsh site was noticeably flat area. The first two cores were taken approximately 5 m from the creek bank and 3 m apart from each other. The entire lengths of both cores, HC1 and HC2, were brought back to the laboratory. A 1.5-m long and 12.5 cm diameter aluminum corer was used to extract the cores and minimize compaction. The serrated bottom cut most effectively through pre- and post-1933 marsh plants. The entire lengths of the cores were extruded and split lengthwise for sampling. In the core HC2, the first 10 cm of both cores were sampled every centimeter, i.e. 0-1 cm, 1-2 cm, etc. At depths greater than ten centimeters, a one centimeter thick sample was taken every fifth centimeter, i.e. 15-16 cm, 20-21 cm, to the bottom of the core.
Cores HC1 and a core from the 1992 study, HZC, were sampled at equidistant intervals of every 20 and 25 cm, respectively, for comparison to HC2. The sampling intervals ranged from the surface to 100 cm. The surface sample (0 cm) represents sediment from the modern S. alterniflora marsh, while the 100-cm measurement came from sediment in the pre-1933 S. alterniflora marsh. HC1 was sampled at smaller intervals, every 20 cm, and analyzed for comparison purposes with the unique mud layers found in the other two cores. This core was completely homogenous with whole and fragmented S. alterniflora plants to a depth of 102 cm, whereas HZC displayed the unique sediment layer as seen in HC2. A previous study found that a mud layer similar to HC2 occurs from approximately 30-80 cm down core (Zieman unpublished, 1992).
In October 1994, two additional cores were taken in order to resolve why one core was homogenous with S. alterniflora throughout the length and why one core had an intermediate layer of sediment. Cores 3 and 4 were taken within 2 m of the first cores and both were 6-7 m from the creekbank (Map 2). The third core (HC3) was taken behind the site of HC1 and showed similar homogenous distribution of S. alterniflora as the first core. An oyster shell was found in 90-91 cm, but the remainder of the core strongly resembled HC1. The fourth core (HC4) was taken north of the second core and also did not contain the distinct mud layer of HC2. Two HC4 samples, 30-31 cm and 35-36 cm, were taken from a slightly darker layer containing S. alterniflora for comparison with the previous two cores.
To establish the composition of nearby sediments for comparison with the marsh sediment cores, two creek bottoms in the area were sampled using a grab sampler. Creek bottom samples were collected at approximately 1m depth. The sediment from Cattleshed Creek was taken about 5 m from the creek bank where all four cores were taken. A more inland location was chosen, Phillips Creek, for sampling another creek bottom. Phillips Creek is approximately 10 km northwest of the Cattleshed Creek marsh. Two creek samples were collected for comparison with the sediment layer in HC2 to determine if the sediment in that core is derived from the nearby creeks.
All samples were kept cool until they couble be frozen and stored in a freezer at 4oC. Once the samples were frozen, they were lyophilized overnight. Next, the samples were ground in a glass mortar and sieved through a 425 micrometer soil sieve to remove any S. alterniflora fragments. A solution of 30% HCl was used to determine the presence of carbonates. Samples containing carbonate were acidified and dried over night in a 50oC oven. Approximately 100 mg sediment was placed in ashed quartz tubes with abundant CuO and metallic Cu. The tubes were evacuated, sealed, and combusted in an 850oC oven for 3 hours. After combustion, the samples were measured for 13C and 15N using the method prescribed by Macko (1981).
Results:
The 13C/12C uses the carbon standard from the PDB Cretaceous Belemite and is
expressed by 13C notation defined as:
13C = 13C/12C sample - 13C/12C standard x 1000
13C/12C standard
15N is calculated in a similar fashion and uses atmospheric N2 as the nitrogen standard (Tan et al., 1979).
The first core (HCl) was 102 cm in length and homogenous with S. alterniflora roots and plants down the entire core length. The sediment was dark grey and contained very little carbonate except for an occassional oyster shell which was removed prior to isotope analysis. The second core (HC2) was 131 cm long and showed a completely different distribution of S. alterniflora from the first core. HC2 had new S. alterniflora marsh growth from the surface to 54 cm down core. A span from 55-113 cm contained S. alterniflora-free sediment that was the same color as the top layer. The presence of dead S. alterniflora material resumed from 113 cm to the bottom of the core.
The 13C values for HC2 range from -16.3 to -18.3‰ and are indicative of a core which may have undergone diagenesis (Table 1) . Samples from centimeter increments in the top 10 cm show a trend toward more depletion and indicate that early diagenetic processes have not occurred. The 13C values remain within + 0.5‰ of 17‰ in lower portions of the core. Deeper in the core, a small enrichment shift occurs as a result of bacterial activity causing isotopic fractionation or as a result of changes in the source of the organic material in the sediments. The 13C values from the HC2 core do not indicate a unique signal for the anamolous mud layer found at 55 to 113 cm in this core. The carbon signals become enriched down core below the surface layer. In the middle of the HC2 core, from 55-113 cm, the mud layer shows 13C enrichment and 15N consistency in comparison to the top layer of the core (Table 1, Figures 1 and 2) .
A mud layer similar to HC2 is also found in HZC and, like HC2, lacks a distinct signal as seen in Figure 1 . The HZC values range within + 1‰ of -18‰ and show a constant signal down core. The mud layer from HZC is found at the 50 and 75 cm intervals, but no distinctive carbon signal is evident. The 50-cm 13C is -17.88‰ and the 75-cm 13C is -18‰. No distinct mud layer was observed in HC1. Fig 1 shows that this core also displays a similar carbon signal to HZC for the entire length of the core. The deepest HC1 measurement at 100 cm is -18.6‰ which lies within +1‰ of the most enriched value -17.7‰ at 80 cm.
The 15N analysis indicates similar trends as the carbon signals for all three cores (Fig 2) . The 15N signal for HC2 and, like the 13C, lacks a distinct signal for the mud layer. The data centers around 7‰ and the upper 10 cm does not indicate early diagenesis as clearly as 13C. The nitrogen distribution in the HZC core also has a consistent signal down core (Fig 2). The 50-cm sample 15N at 5.7‰ is slightly more depleted than the other samples. HZC sediments follow a simliar pattern and show depletion in the mud layer, the 60 and 80 cm samples (Fig 2). Both of the HZC and HC1 cores show enrichment below the surface layers and then slight depletion toward 100 cm where both cores are within +0.5‰ of each other.
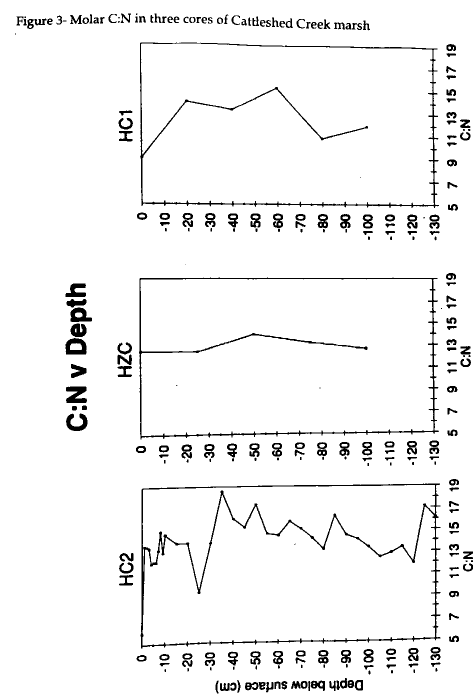
The molar C:N ratio for HC2 is less at the surface of the core and is greater at the bottom of the core (Fig 3) . At the surface, this ratio is 6 and indicates that there is more nitrogen at the surface than at 130 cm where the ratio is 16. The 55-113 cm layer shows a trend of slight increase in molar C:N, but then the trend shifts toward lesser amounts of carbon near the top. The C:N graph for HZC (Fig 3) shows a consistent trend with depth as the 0 and 100 cm samples have a ratio of 12.5 and 12.66, respectively. The HC1 core does not display the homogeneity of HZC, but shows a consistent C:N down core (Fig 3) . The surface sample of this core has a slightly lower ratio of 9, but is not as low as the surface sample from HC2.
The nitrogen content of HC2 decreased slightly down core from as high as 1.9 mg N g-1 sediment to 1.2 mg N g-1 sediment at the bottom (Fig 4) . The carbon content shows higher amounts of carbon, 20 mg C g-1 sediment , in the upper 10 cm except for 10 mg C g-1 sediment at 0 cm (Fig 5) . At depth, the carbon content hovers around 16-18 mg C g-1 sediment and shows a slight increase near the surface.
To determine whether mixing of organic sources in sediments occurs with depth, the relationship of 13C and 15N is analyzed. Peters (1978) found a strong correlation between the 13C and 15N values of sediments. However, there is no established relationship between the carbon and nitrogen signals for any of the samples from the current study (Fig 6).
The samples from Cattleshed and Phillips Creeks were compared with the mud layers from cores HC2 and HZC. Cattleshed Creek bottom sediment measured 8.39‰ and -20.43‰ for 15N and 13C, respectively. Phillips Creek bottom sediment measured 7.81‰ and -19.09‰ for 15N and 13C, respectively. These signals did not match the data from the HC2 mud layer and varied about 3‰ in 13C (-16 to -17‰). The nitrogen signal for the Cattleshed Creek sediment is higher in comparison to the 55-113- cm layer of HC2 (Table 1) . Only one sample from the HC2 mud layer resembles the nitrogen signal of the creek bottom. The carbon signal from the creek sediments is more depleted than that from HC2. In addition, both creeks measure 0.6 and 0.7 mg N/g sed whereas the cores range from 1 to 1.8 mg N/g sed. The amount of carbon in the bottom sediments (6 to 12 mg C g-1 sediment) is significantly lower than the carbon content in the marsh samples (14 to 20 mg C g-1 sediment) (Table 1). Values from the Cattleshed Creek marsh cores range from -16 and -18‰ for 13C and between 6 to 8‰ for 15N, while the S. alterniflora plants from Hog Island measure -14‰ and 4‰ for 13C and 15N, respectively.
A Student's t-test was performed on the HC2 and HZC cores to test for significant difference between the top portion of the post- 1933 Cattleshed Creek marsh and remainder of the cores which were suspected to have undergone diagenesis. The t-test on the masses of carbon and nitrogen per sediment sample was performed using the Quatro-Pro program. A confidence level of 95% was chosen a priori and resulted in a significant difference between the two portions of the HC2 core. The mean for mg N g-1 sediment in the upper 0-20 cm of HC2 is 1.67 and from 25-130 cm is 1.31 (t=5.66, p> 0.0, critical t =2.09). The mean for mg C g-1 sediment in the upper 0-20 cm of HC2 is 19.17 and from 25-130 cm is 16.17 (t=2.4, p> 0.03, critical t =2.13). The HZC core did not meet the 95% degree of confidence in the difference between the 0-25 and 50-100 cm layers. In the upper 0-25 cm of HZC, the mean for mg N g-1 sediment is 1.76 and for 25-100 cm is 1.37, while the mean for mg C g-1 sediment in the upper 0-25 cm is 18.86 and from 25-100 cm is 15.52. The t-test shows that a significant difference does not exist between the two layers of HZC.
Discussion:
Prior to this study, the Chesapeake and Potomac hurricane was believed to be
responsible for the anomalous sediment layer found in cores of the Hog Island
marsh. The grey mud layer is distinctly devoid of any S. alterniflora
plant debris. The current investigation indicates that the hurricane may be
responsible for the resuspension of local sediments, but not the deposition of
lagoonal mud as previously suggested. Rather, the sediments of the mud layer,
as well as above and below, result from either historic deposition from a
source common to the marsh or periodic mixing with different organic materials.
The absence of a significant shift in the carbon isotope signal in the mud
layer at 55-113 cm suggests that the organic matter in this layer shares a
similar source with the remainder of the HC2 core.
The mixing of two organic sources in the sediment is an important process that affects the stable isotope signature of marsh sediment. In the Cattleshed Creek marsh, S. alterniflora is one possible contributor to organic matter in the sediment layers. In a study of a Georgia salt marsh, the isotopic composition of the neighboring creek bank surface sediment was -18.9‰, whereas the Cattleshed Creek bottom sediments measure -20.4‰. Much of the detrital carbon in Georgia salt marshes is produced by S. alterniflora (Haines, 1976). The nitrogen and carbon signals in the mud layer of HC2 are not identical to creek bottom nor the S. alterniflora plants, but could result from a mixing of S. alterniflora ( 13C -14‰) with creek bank sediment ( 13C -20‰). Therefore, the mud layer in HC2 sediments could be the result of creek bottom sediments mixing with S. alterniflora organic matter.
The significant decline in carbon content indicates that diagenetic processes are underway in the mud and lower layers of HC2. The present study examines whether organic material in the cores underwent or is currently undergoing diagenesis. If diagenesis is responsible, then the kinetic isotope effects that occur during decomposition could change the isotopic signature. Core HC2 shows enrichment in 13C and 15N with depth similar to those observed by Macko (1981). The top layer of the HC2 cores is composed of a mixture of marsh sediments and S. alterniflora. Within the top 10 cm of the core, the values average around -18‰, but down core the 13C trend is toward a slight enrichment. Early diagenesis can cause enrichment in the carbon signal. The lower sediments of the post- 1933 marsh growth are more enriched than the surface sediments because early diagenesis previously occured. The pre-1933 marsh also has undergone early diagenesis which is exemplified by the 1‰ shift to -17‰ (Fig 1). Bacterial activity may also be responsible for the enrichment from -18‰ to -17‰ in the upper 35 cm of HC2. The -17‰ sample near 113 cm resembles the value measured at 55-cm depth which is -17.25‰. This trend indicates that lower portion of the post- 1933 layer and the pre- 1933 marsh sediment have undergone diagenesis. The mud layer in this core is more enriched than the surface sediments and the slight enrichment is not limitted to the process of diagenesis. This study suggests that the carbon signal of the mud results from a mixing of sources as well as diagenesis as seen in the other parts of the core.
In general, it is assumed that little or no change occurs in the isotopic signal during early diagenesis. Changes have been observed to be negligible in some organic rich sediments. In addition, variations in 13C of organic material record the sedimentary history of an area (Macko et al., 1993). The signal of the mud layer offers information about the history and source of the sediment. In the other sections of HC2, the carbon signal indicates that diagenesis is either underway or already completed. In the upper layer, where early diagenesis is underway, depletion of 13C possibly is caused by loss of 13C fractions of original organic matter or intramolecular fractionations and loss of enriched molecular groups (Macko, 1981). Loss of carboxyl or protein carbon would deplete the carbon content, whereas loss of lipid material would enrich the sediment (Macko, 1981). Carboxyl groups of amino acids are more enriched in 13C than other carbon constituents (Macko et al., 1993). Future studies might use the amino acid abundances to detail more about the role of diagenesis in specific portions of the core.
The nitrogen signal of the HC2 core is not as useful as the 13C signal in determining the role of diagenesis in this core. Nitrogen does not show as distinct a trend of enrichment from diagenesis as carbon in these cores. As with the carbon isotope composition, the mud layer from 55-113 cm does not show enrichment downcore because diagenetic processes have not affected the organic matter in the sediment. Thereby, the mixing hypothesis is further supported.
The HC2 molar C:N also follows the Kleberg Point pattern and preferentially loses nitrogen with depth (Macko, 1981). As depth increases, the trend toward an increasing molar C:N indicates that the nitrogen content decreases more than the carbon content. The top 10 to 20 cm of the post-1933 marsh show increasing C:N as expected, while the bottom of the core shows similar and larger ratios. Diagenesis has already occured in the lower layers as demonstrated by a higher C:N. This decreasing nitrogen content deep in HC2 supports the idea of bacterial attack on the organic matter. The carbon and nitrogen pattern in the mud layer is consistent with the trends indicative of either prior diagenesis or mixing of two sources. While the isotopic abundance of nitrogen was not as insightful as the carbon signal, the abundance of nitrogen clearly signifies early diagenetic effects. An amino acid profile would be useful in further studies because it would help discern why the HC2 C:N ratio decreases near the surface .
The role of molar carbon and nitrogen are essential to verify the presence of early and past diagenesis in HC2. With the exception of the surface layer, the amount of carbon also decreases with depth (Fig 4) . Carbon content remains fairly stable downcore, as in Meyers (1993). The amount of carbon throughout the core is generally around 1% which demonstrates how very little organic matter is in the sediment (Table 1). As observed by Jasper (1989) and Macko (1993), diagenesis preferentially results in the loss of nitrogen which is seen from the surface sample through 55 cm where the mud layer starts. Similarly, the pre-1933 layer exhibits a lower content of nitrogen because that portion of the core has previously undergone diagenesis. The t-test performed on HC2 indicates that a significant difference exists between the upper 20 cm which has not undergone diagenesis and the mud layer and the pre- 1933 marsh. This test supports the two mechanisms for the history of the mud layer. The sediments in the mud layer and the pre- 1933 layer have either undergone diagenetic process that have changed the content of nitrogen and carbon or result from the mixing of two sources not found in the post- 1933 sediments.
The HZC and HC1 cores were sampled for comparison with the results from HC2. The 13C signal in HZC appears to be generally homogenous throughout and does not show signs of enrichment as in HC2. In HZC, the mud layer is not isotopically distinct and the marsh layers are not indicative of significant diagenetic effects. The t-test performed on the amounts of nitrogen and carbon in HZC indicate that a significant difference does not exist between the upper and lower portions of the core. These sediments show a difference in the means between the upper 25- and lower 75- cm, however confidence in the difference is not as high as in HC2.
Likewise, the homogenous HC1 sediments lack the enrichment of HC2 which signifies diagenesis at depth. Whereas the HC2 core demonstrates a fairly constant 15N signal, HZC shows a 2‰ variation down core. The HC1 15N signal varies between 5 and 7‰ which does not necessarily indicate diagenesis because the core was homogenous with S. alterniflora. Therefore, the surface portions of the core should be more depleted than the older parts because they should not have undergone diagenesis as the pre-1933 marsh sediments. However, the data in Fig 2 suggest that the HC1 marsh sediments have not undergone diagenesis.
The HZC and HC1 cores do not demonstrate an increasing molar C:N with depth. The nitrogen content is not decreasing as expected if diagenesis were underway. The amount of carbon differs between the two cores. The HZC core is fairly constant in carbon abundance, except for the 50 cm sample which drops from 19 to 12 mg C g-1 sediment. The HC1 core also varies, but does not display strong diagenetic tendencies. The nitrogen abundance graphs are more indicative of cores which have undergone diagenesis (Fig 5) . The molar carbon abundances for HZC and HC1 clearly indicate the possibility of early diagenesis in these two cores, however the isotopic compositions are not as persuasive. These cores do not show the effects of diagenesis as HC2 does.
The presence of a mud layer void of S. alterniflora in HC2 may have two possible explanations for its origin. Based on 14C analysis of S. alterniflora below the mud layer, the Chesapeake and Potomac hurricane of 1933 is believed to have deposited bottom sediments on the marsh surface as seen in HC2 and HZC. However, the results of the current study suggest two alternate explanations for the origin of the mud layer found irregularly in the Cattleshed Creek marsh. One explanation is that the mud layer results from local redistribution of pre-1933 marsh surface sediment. The in situ source mechanism suggests that the hurricane dislocated sediments on the marsh surface and disbursed these sediments into low lying areas of the marsh. The sediments were deposited into possibly old tidal creeks or other depressed areas where the post 1933 marsh soon recovered. No S. alterniflora is located in the mud layer, because only surface marsh sediments were redistributed into the depressed areas. Post- 1933 marsh grass recovered above the deposited sediments and grew on the flat marsh. A second explanation is that two different end members are the source of the sediment. The 13C and 15N signals of the mud layer could result from a mixing of S. alterniflora and Cattleshed creek bottom sediments. As previously stated, the S. alterniflora 13C and 15N values are -14‰ and 4‰, respectively. The Cattleshed creek sediments are -20.4 and 8.4‰, respectively (Table 1). The HC2 mud layer averages between -16 and -17‰ for 13C and between 6 and 7‰ for 15N. The two sources could have mixed as seen in Tan and Strain (1979) and Peters (1978). The HC2 mud layer indicates that half of the carbon and nitrogen signals are derived from the S. alterniflora and half from the creek bottom sediments. These two explanations are not necessarily independent of each other because the mud layer could have resulted from a combination of different processes.
Conclusions:
The purpose of this study was to examine sediments extracted from a S.
alterniflora marsh to determine the organic source of an anomalous mud
layer and the processes of early diagenesis. Carbon and nitrogen isotope
analysis enable the source of the sediment and a brief detail of early
diagenesis to be ascertained. In this study the mixing process is examined as
both the carbon and nitrogen signals indicate that mixing could have occured
between the adjacent creek bottom sediments and the S. alterniflora or
from an in situ redistribution of sediments throughout the history of
the marsh. Lagoonal and creek sediments are not the sole source of the mud
layer found in one core as previously thought. This study proposes that the
sediment anomaly results from one of two processes. Either the HC2 mud layers
results from the mixing of two sources of organic material or the
redistribution of surface marsh sediments under the force of the hurricane.
Early diagenesis is seen throughout the recent history of the marsh sediment in
HC2. This brief history is recorded in the sediment as the carbon signal
becomes enriched down core and the nitrogen signal shows slight enrichment.
The isotope signals suggest that the combination of organics in creek sediments
and S. alterniflora could be responsible for the isotopic ratios
measured in the marsh sediment. Further analysis of sediment amino acid
profiles would provide additional information necessary to determine the role
of diagenesis and the source of organic material in the Cattleshed Creek marsh
sediments.
Anderson, B., Scalan, R., Behrens, E. and Parker, P., 1992, Stable C isotope variations in sediment from Baffin Bay, Texas, USA: Evidence for cyclic changes in organic matter source, Chemical Geology 101:223-233.
Brown, F., Baedecker, M., Nisenbaum, A. and Kaplan, I., 1972, Early diagenesis in a reducing fjord, Saanich Inlet, British Columbia-III. Changes in organic constituents of sediment, Geochimica Cosmochimica Acta 36:1185-1203.
Burdige, D. and Martens, C., 1988, Biogeochemical cycling in an organic rich coastal marine basin: 10. The role of amino acids in sedimentary carbon cycling and nitrogen cycling, Geochimica Cosmochimica Acta 52:1572-1584.
Cifuentes, L., 1991 , Spatial and Temporal Variations in Terrestrially Derived Organic Matter from Sediments of the Delaware Estuary, Estuaries 14:4:414-429.
Cobb, H., 1991, The Chesapeake-Potomac hurricane of 1933, Weatherwise, 44:24-29.
Farrington, J., Henrichs, S. and Anderson, R., 1977, Fatty acids and Pb-210 geochronology of a sediment core from Buzzards Bay, Mass., Geochimica Cosmochimica Acta 41:289-296.
Fogel, M. and Cifuentes, L., 1993, "Isotope Fractionation during Primary Production" in Organic Geochemistry, ed Macko, S. and Engel, M., Plenum Press: New York. pp 73-96.
Haines, E., 1976, Stable C Isotope Ratios in the Biota, Soils and Tidal Water of a Georgia Salt Marsh, Estuary and Coastal Marine Science 4:609-616.
Henrichs, S. and Farrington, J., 1987, Early diageneis of amino acids and organic matter in two coastal marine sediments, Geochimica Cosmochimica Acta 51:1-15.
Jasper, J. and Gogasian, R., 1990, The sources and deposition of organic matter in the Late Quaternary Pigmy Basin, Gulf of Mexico, Geochimica Cosmochimica Acta 54:1117-1132.
Kawamura, K., Ishiwatari, R., and Ogura, K., 1987, Early Diagenesis of Organic Matter in the water column and sediments: Microbial degradation and resynthesis of lipids in Lake Haruna, Organic Geochemistry 11:4:251-264.
Macko, S., 1981, Stable nitrogen isotope ratios as tracers of organic geochemical processes, Ph.D. thesis, University of Texas, Austin.
Macko, S., Engel, M. and Parker, P., 1993, "Early Diagenesis of Organic Matter in Sediments: Assessment of Mechanisms and Preservation by the Use of Isotopic Molecular Approaches", in Organic Geochemistry, ed. Macko, S. and Engel, M., Plenum Press: New York. pp. 211-224.
Macko, S., Engel, M. and Qian, Y., 1994, Early diagenesis and organic matter preservation-a molecular stable carbon isotope perspective, Chemical Geology 114:365-379.
Meyers, P. and Ishiwatari, R., 1993, "Early Diagenesis of Organic Matter in Lacustrine Sediments", in Organic Geochemistry, ed. Macko, S. and Engel, M., Plenum Press: New York. pp. 185-209.
Meyers, P., Leenheer, M., Eadie, B. and Maule, S., 1984, Organic geochemistry of suspended and settling particulate matter in lake Michigan, Geochimica Cosmochimica Acta 48:3:443-452.
Ostrom, P. and Fry, B., 1993, "Sources and Cycling of Organic Matter within Modern and Prehistoric Food Webs", in Organic Gochemistry, ed. Macko, S. and Engel, M., Plenum Press: New York. pp.785-798.
Peters, K., Sweeney, P., and Kaplan, I., 1978, Correlation of C and N Stable Isotope Ratios in sedimentary organic matter, Limnology and Oceanography 23:598-604.
Shultz, D., and Calder, J., 1976, Organic carbon 13C/12C variations in estuarine sediments, Geochimica Cosmochimica Acta 40:381-385.
Sigleo, A. and Macko, S., 1985, "Stable Isotope and Amino Acid Composition of Estuarine Dissolved Colloidal Material" in Marine and Estuarine Geochemistry ed., Sigleo, A. and Hattori, A., Lewis Publishers, Inc. Chelsea, MI, pp. 29-46.
Tan, F. and Strain, P., 1979, Organic C Isotope Ratios in Recent Sediments in St. Lawrence Estuary and the Gulf of St. Lawrence. Estuary and Coastal Marine Science, 8:213-225.
Tan, F. and Strain, P., 1983, Sources, sinks and distribution of organic carbon in the St. Lawrence Estuary, Canada, Geochimica Cosmochimica Acta 47:125-132.
Zieman, J., Macko, S., and Mills, A., 1984, Role of Seagrasses and Mangroves in Estuarine Food Webs: Temporal and Spatial Changes in Stable Isotope Composition and Amino Acid content during decomposition, Bulletin of Marine Science 35:380-392.