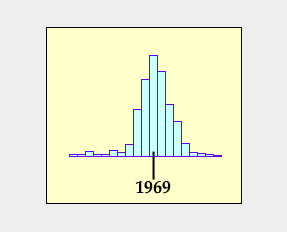
| A Histogram of the Most Frequent Dates of Change on Hog Island |
|
| A Histogram of the Most Frequent Dates of Change on Hog Island |
|
|
The job at hand then was to collect the data and find the critical change date all along the coast. We first did such a study on Hog Island. Malcomb Sculley and Dave Watkins, two undergraduate students at the University of Virginia, were supported one summer by the National Science Foundation to work with the shoreline position data at points along the Hog Island coast at 50 meters intervals. Well, for a 7 kilometer long island like Hog Island that means that did the analysis 140 times and then found the critical date for each of the 140 locations. The change did not happen the same year at all 140 locations. When they summarized the data as a histogram of most common dates they found that the most common date of change was 1969.